Run CAGR Calculator
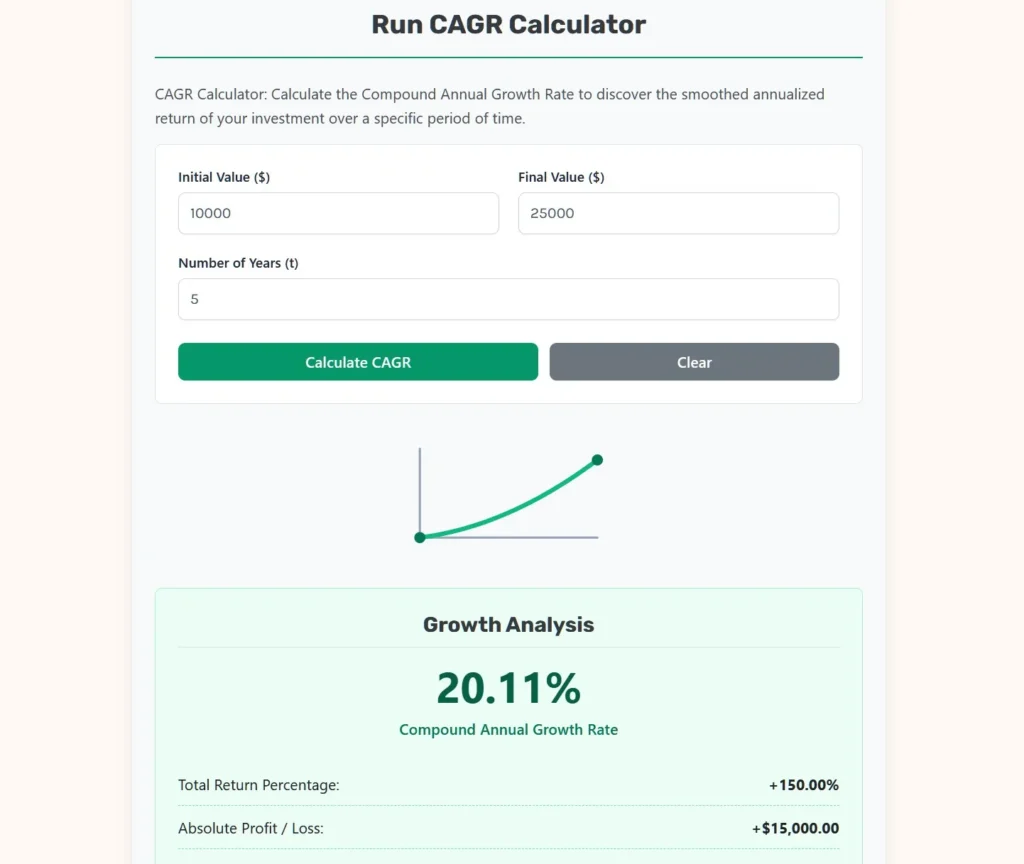
CAGR Calculator: Calculate the Compound Annual Growth Rate to discover the smoothed annualized return of your investment over a specific period of time.
CAGR Math Explained
What is CAGR?
The Compound Annual Growth Rate (CAGR) isn’t the actual return of your investment in any single year. Instead, it is a representational “smoothed” figure. It tells you what the annual growth rate would have been if the investment had grown at the exact same steady rate every single year, assuming profits were reinvested at the end of each year.
CAGR = [ ( Final Value / Initial Value )( 1 / Years ) ] − 1
Why use CAGR instead of Average Return?
Average return can be highly misleading due to volatility. If an investment drops 50% in year one (e.g., $100 to $50), and gains 100% in year two (e.g., $50 to $100), the average return is mathematically +25% (-50 + 100 = 50 / 2). However, you started with $100 and ended with $100, meaning you made no money! CAGR correctly calculates this return as 0%.
What Is CAGR Stands for?
CAGR stands for Compound Annual Growth Rate. It is a way of expressing the rate at which an investment, business metric, asset value, revenue stream, or other quantity would have grown each year over a specific period if the growth had occurred at one constant compounded annual rate.
CAGR is especially useful when you know an initial value, a final value, and the length of the period, but the actual path between those two points may have been irregular.
For example, an investment might begin at 10,000 and end at 25,000 after five years. It may have increased strongly in some years, declined in others, and produced a very different return in each individual year. CAGR converts that overall change into one annualized growth rate that mathematically connects the starting value to the ending value.
The calculator provided with this page is designed around exactly those three inputs: initial value, final value, and number of years. It then reports CAGR together with total return percentage and absolute profit or loss.
What Does CAGR Mean?
CAGR answers a specific mathematical question:
What constant annual compounded growth rate would turn the initial value into the final value over the stated period?
It is important to understand that CAGR is generally not the actual return earned in every year.
Suppose an investment goes through the following path:
- Year 1: +20%
- Year 2: −10%
- Year 3: +35%
- Year 4: −5%
- Year 5: +15%
The annual returns are different from one year to the next. CAGR does not attempt to claim that the investment actually earned the same percentage every year.
Instead, CAGR creates a mathematically equivalent constant annual growth rate connecting the starting and ending values.
The U.S. Securities and Exchange Commission’s Investor.gov describes compound growth as earning returns not only on the original invested money but also on returns that remain invested.
How Is CAGR Calculated?
The standard CAGR formula is:
CAGR = (Final Value ÷ Initial Value)^(1 ÷ Number of Years) − 1
To express the result as a percentage:
CAGR (%) = [(Final Value ÷ Initial Value)^(1 ÷ Number of Years) − 1] × 100
Where:
- Initial Value = value at the beginning of the measurement period
- Final Value = value at the end of the measurement period
- Number of Years = length of the period
- CAGR = compound annual growth rate expressed as a decimal or percentage
The calculator implements this formula directly by dividing the final value by the initial value, taking the reciprocal of the time period, and subtracting 1.
A Simple CAGR Example
Suppose an investment grows from $10,000 to $25,000 over 5 years.
First calculate the ending-to-beginning value ratio:
$25,000 ÷ $10,000 = 2.5
Then apply the five-year exponent:
CAGR = 2.5^(1 ÷ 5) − 1
The resulting CAGR is approximately:
20.11%
This means that an investment growing at a constant compounded rate of approximately 20.11% per year would move from $10,000 to $25,000 over five years.
It does not mean the investment actually earned exactly 20.11% in each of those five years.
Why Is CAGR Useful?
CAGR is useful because raw beginning and ending values do not immediately tell you how fast something grew on an annualized basis.
Consider two investments:
| Investment | Starting Value | Ending Value | Period |
|---|---|---|---|
| A | $10,000 | $20,000 | 5 years |
| B | $10,000 | $20,000 | 10 years |
Both doubled in value, but they did not grow at the same annualized rate.
Investment A achieved the same ending value in half the time, so its CAGR is substantially higher.
This illustrates one of the most important features of CAGR: time matters.
A 100% total increase over three years is very different from a 100% total increase over fifteen years.
CAGR vs. Total Return
CAGR and total return answer different questions.
Total return measures the overall percentage change between the starting and ending values.
The formula is:
Total Return (%) = [(Final Value − Initial Value) ÷ Initial Value] × 100
For example:
Initial Value = $10,000
Final Value = $25,000
Then:
Total Return = [($25,000 − $10,000) ÷ $10,000] × 100
Total Return = 150%
So the investment increased by 150% in total.
CAGR then translates that total change into an annualized compounded rate over the specified number of years.
The calculator reports both figures separately.
CAGR vs. Absolute Profit
Absolute profit is another different measurement.
The formula is:
Profit or Loss = Final Value − Initial Value
For the same example:
$25,000 − $10,000 = $15,000
The investment therefore produced an absolute gain of $15,000.
The three measures can be summarized as:
| Metric | What It Tells You |
|---|---|
| Absolute profit | How much money was gained or lost |
| Total return | How much the investment changed as a percentage |
| CAGR | The equivalent constant annual compounded growth rate |
The calculator displays all three concepts in its results area, with CAGR as the primary result.
Why CAGR Can Be Better Than a Simple Average of Annual Returns
A simple average of yearly percentage returns can give an incomplete or misleading picture when returns vary significantly.
Consider a two-year example:
- Start: $100
- After Year 1: $50
- After Year 2: $100
The first year’s return was:
−50%
The second year’s return was:
+100%
The arithmetic average is:
(−50% + 100%) ÷ 2 = 25%
But the investment started and ended at exactly $100.
Therefore, the investor did not experience a 25% annual compounded growth rate.
CAGR correctly reflects the beginning and ending values:
CAGR = ($100 ÷ $100)^(1 ÷ 2) − 1
CAGR = 0%
This is one of the clearest reasons CAGR is useful for comparing long-term growth.
The calculator’s existing educational section uses this same conceptual example to distinguish CAGR from a simple average return.
CAGR Represents a Smoothed Growth Rate
The word smoothed is important.
Imagine that an investment has a highly uneven history:
| Year | Actual Return |
|---|---|
| 1 | +40% |
| 2 | −20% |
| 3 | +10% |
| 4 | −5% |
| 5 | +30% |
CAGR does not replace this history.
Instead, it asks:
What single constant annual compounded rate would produce the same beginning-to-ending result?
That makes CAGR a summary measure rather than a description of the actual annual performance path.
This distinction is critical when explaining CAGR to investors. A CAGR percentage should never be interpreted as proof that the investment produced that return every year.
How Compound Growth Works
CAGR is based on compounding.
With simple growth, a percentage increase may be calculated only against the original principal.
With compound growth, gains remain part of the value on which subsequent growth can occur.
For example, suppose $1,000 grows at 10% annually.
After Year 1:
$1,000 × 1.10 = $1,100
After Year 2:
$1,100 × 1.10 = $1,210
After Year 3:
$1,210 × 1.10 = $1,331
The amount of growth itself begins generating additional growth.
Investor.gov describes this principle as compound growth and explains that returns can generate further returns while money remains invested.
CAGR and the Power of Time
The effect of compounding becomes increasingly important as the investment period gets longer.
Consider $10,000 growing at a constant 10% annual rate:
| Year | Approximate Value |
|---|---|
| 0 | $10,000 |
| 1 | $11,000 |
| 2 | $12,100 |
| 3 | $13,310 |
| 5 | $16,105 |
| 10 | $25,937 |
| 20 | $67,275 |
| 30 | $174,494 |
The increase is not linear.
At first, the annual increase is relatively small. Later, the same percentage is applied to a much larger balance.
This is why two investments with identical CAGR percentages can generate dramatically different ending values depending on the starting amount and holding period.
What Is a Good CAGR?
There is no single CAGR percentage that can universally be classified as good.
Whether a CAGR is attractive depends on:
- The type of investment
- The risk taken to achieve the return
- The time period
- Inflation
- Taxes
- Fees and expenses
- The relevant benchmark
- The asset class
- The economic environment
- The investor’s objective
For example, a 6% CAGR might be strong for one low-risk objective but inadequate for another investment strategy carrying substantially greater risk.
Investor.gov states that investments do not have a fixed rate of return and notes that some experts use a historical 7%–10% range as a useful estimate for long-term diversified U.S. stock investments, while emphasizing that investment returns are not guaranteed.
That information should not be interpreted as meaning that a CAGR between 7% and 10% is automatically good for every investment.
Is 12% CAGR Good?
A 12% CAGR represents a strong annualized growth rate in many contexts, but whether it is actually good depends on what generated it and what risks were taken.
For example, a 12% CAGR over ten years means that $10,000 would theoretically grow to approximately:
$10,000 × (1.12)^10
≈ $31,058
That is a substantial increase.
However, historical performance alone does not establish what future performance will be. A 12% CAGR could also conceal substantial interim losses, high volatility, concentration risk, leverage, or other risks.
Therefore, the correct question is not simply:
Is 12% CAGR good?
A better question is:
How does the 12% CAGR compare with an appropriate benchmark after considering risk, fees, taxes, and the investment period?
Is 30% CAGR Good?
A 30% CAGR is mathematically a very high growth rate.
For example, $10,000 compounded at 30% annually for five years would become approximately:
$10,000 × (1.30)^5
≈ $37,129
After ten years:
$10,000 × (1.30)^10
≈ $137,859
The example demonstrates how powerful compounding becomes at high rates.
However, a high historical CAGR should not automatically be treated as a low-risk or sustainable return. Very high growth rates may accompany substantial volatility or unusual business conditions.
The SEC’s investor resources emphasize the importance of considering investment risk and the fact that historical performance does not guarantee future results.
How Do I Calculate CAGR Without a Calculator?
You can calculate CAGR manually using four steps.
Step 1: Identify the initial value
This is the value at the beginning of the period.
Example:
Initial Value = $10,000
Step 2: Identify the final value
This is the value at the end.
Final Value = $25,000
Step 3: Determine the time period
Suppose:
Time = 5 years
Step 4: Apply the formula
CAGR = ($25,000 ÷ $10,000)^(1 ÷ 5) − 1
Then multiply by 100 to express the result as a percentage.
CAGR ≈ 20.11%
The online calculator performs these steps automatically.
How Do I Calculate CAGR in Excel?
CAGR can be calculated in Excel using the standard mathematical formula.
If:
- Initial value is in cell B2
- Final value is in cell B3
- Number of years is in cell B4
the formula can be written as:
=(B3/B2)^(1/B4)-1
Format the resulting cell as a percentage.
For example:
| Cell | Value |
|---|---|
| B2 | $10,000 |
| B3 | $25,000 |
| B4 | 5 |
| B5 | =(B3/B2)^(1/B4)-1 |
The result is approximately:
20.11%
This is mathematically equivalent to the calculation performed by the online calculator.
CAGR Formula in Google Sheets
Google Sheets can use the same formula:
=(B3/B2)^(1/B4)-1
The same mathematical relationship works in spreadsheet software because CAGR is fundamentally an exponentiation calculation rather than a special calculator-only operation.
CAGR With a Negative Growth Period
CAGR can be negative.
Suppose:
Initial Value = $20,000
Final Value = $15,000
Time = 5 years
Because the final value is below the initial value, the resulting CAGR will be negative.
A negative CAGR means the value declined on an annualized compounded basis over the measurement period.
The calculator detects negative CAGR values and changes its result visualization to indicate declining growth.
A negative CAGR should not necessarily be interpreted as evidence that every individual year was negative. The value could have increased during some years and declined sharply during others while still producing a negative overall CAGR.
What Happens If the Final Value Is Equal to the Initial Value?
If the initial and final values are identical, the CAGR is:
0%
For example:
Initial Value = $10,000
Final Value = $10,000
Time = 5 years
Then:
CAGR = ($10,000 ÷ $10,000)^(1 ÷ 5) − 1
CAGR = 1 − 1
CAGR = 0%
This is true regardless of how long the period is, provided the beginning and ending values are the same.
The investment could have experienced substantial volatility during the period, but CAGR considers only the starting value, ending value, and duration.
What Happens When the Investment Doubles?
Doubling means the final value is twice the initial value.
For a five-year period:
CAGR = 2^(1 ÷ 5) − 1
CAGR ≈ 14.87%
For a ten-year period:
CAGR = 2^(1 ÷ 10) − 1
CAGR ≈ 7.18%
This illustrates why the phrase “the investment doubled” is incomplete without mentioning the time period.
A doubling in five years and a doubling in ten years represent very different annualized growth rates.
CAGR for Business Growth
CAGR is not limited to investment portfolios.
Businesses can use CAGR to measure the growth of:
- Revenue
- Earnings
- Customers
- Assets
- Market size
- Sales volume
- Geographic expansion
- Subscription counts
- Production capacity
For example, if a company’s annual revenue increased from 2 million to 5 million over seven years, CAGR can summarize the equivalent annualized rate of growth.
Public companies frequently use CAGR when describing multi-year growth in financial and operating metrics. SEC-filed company materials use CAGR for measures such as revenue, earnings per share, dividends, and shareholder returns.
CAGR for Comparing Companies
CAGR can help compare businesses that started at different levels.
Suppose:
| Company | Beginning Revenue | Ending Revenue | Period |
|---|---|---|---|
| A | $10 million | $20 million | 5 years |
| B | $100 million | $200 million | 5 years |
Both doubled their revenue.
Their CAGRs are therefore identical.
The difference is scale, not annualized growth.
This makes CAGR particularly useful when comparing relative growth rates across businesses of different sizes.
However, revenue CAGR should not be treated as a complete measure of business quality. Profit margins, cash flow, debt, capital requirements, and profitability may tell a very different story.
CAGR for Market and Industry Analysis
Analysts can use CAGR to summarize multi-year growth in an industry or market.
For example, suppose an industry grows from 50 billion to 80 billion over eight years.
The CAGR tells you the constant annualized rate that would connect those two values.
It is particularly useful in reports because a single CAGR figure can summarize a long period more clearly than presenting only the beginning and ending numbers.
Nevertheless, analysts should examine the underlying yearly data whenever possible. CAGR compresses the path into one number and therefore removes information about volatility, interruptions, and changes in the growth trajectory.
CAGR Does Not Show Volatility
One of CAGR’s biggest strengths is also one of its limitations.
It simplifies performance.
That makes it convenient for comparisons, but it means that important details can disappear.
Consider two investments that both have a 10% CAGR over ten years.
Investment A may have grown gradually with relatively modest fluctuations.
Investment B may have experienced:
- A 45% decline
- A rapid recovery
- Several years of extreme volatility
- Strong growth near the end
Both could ultimately produce the same CAGR.
The CAGR alone cannot tell you which investment was more comfortable to hold or which involved greater risk.
CAGR Does Not Measure Risk
CAGR is a growth statistic, not a risk statistic.
It does not tell you:
- Maximum drawdown
- Volatility
- Standard deviation
- Probability of loss
- Liquidity risk
- Credit risk
- Concentration risk
- Leverage
- Counterparty risk
A sensible investment analysis should therefore use CAGR alongside appropriate risk and performance measures.
For example, two investments might have similar CAGR but radically different maximum drawdowns.
That distinction can be very important to an investor.
CAGR and Cash Flows
A standard CAGR calculation assumes a simple beginning value and ending value.
This becomes an important limitation when money is added to or withdrawn from the investment during the measurement period.
Suppose an investor contributes:
- $10,000 initially
- $2,000 one year later
- $5,000 two years later
A simple CAGR using only the initial and final account balances does not properly isolate the investment’s performance because the changing account balance is affected by the investor’s cash flows.
For situations involving multiple contributions or withdrawals, metrics such as internal rate of return (IRR), money-weighted return, or time-weighted return may be more appropriate depending on the objective.
Therefore, the standard CAGR calculator should be used when the beginning and ending values adequately describe the growth period being analyzed.
CAGR and Dividends
Another important consideration is whether the values being compared include reinvested dividends or other distributions.
An investment’s price CAGR and total-return CAGR can be different.
For example, a stock might have modest price appreciation while also distributing substantial dividends. If those dividends are reinvested, the investor’s overall wealth accumulation can differ significantly from the change in the stock’s quoted price alone.
When comparing CAGR figures, always verify what the beginning and ending values represent.
A meaningful comparison should use consistent definitions throughout the calculation.
CAGR and Inflation
CAGR is normally a nominal growth measure unless the underlying values have been adjusted for inflation.
Suppose an investment has a 6% nominal CAGR while inflation averages 3%.
The investment grew by 6% in nominal terms, but its purchasing power increased by less than 6%.
This distinction matters for long-term financial planning.
When comparing investment growth with living costs or purchasing power, consider whether you need:
Nominal CAGR
or:
Real CAGR after inflation
The appropriate analysis depends on the question being asked.
CAGR and Investment Fees
The calculator uses the beginning and ending values supplied by the user. Therefore, any fees, taxes, and other costs included or excluded from those values will affect the resulting CAGR.
For an accurate analysis, make sure you know whether the values are:
- Before fees
- After fees
- Before taxes
- After taxes
- With dividends included
- With dividends excluded
Two investments can have the same gross CAGR but different net results after expenses.
This is especially important when comparing investment products with different expense structures.
How Accurate Is a CAGR Calculation?
The mathematical calculation itself can be highly precise, but the quality of the result depends on the quality of the inputs.
A CAGR calculated from accurate beginning and ending values is mathematically reliable.
However, if the starting value is incorrect, the ending value is incorrect, or the duration is misstated, the CAGR will also be wrong.
The calculator therefore validates the main inputs and requires the initial value and the period to be greater than zero.
The displayed CAGR is rounded to two decimal places for readability.
How to Use a CAGR Calculator Correctly
For the most reliable result:
- Enter the correct starting value.
- Enter the correct ending value.
- Enter the actual number of years in the measurement period.
- Make sure the beginning and ending values represent comparable measurements.
- Check whether dividends, distributions, fees, and taxes are included.
- Interpret CAGR as an annualized growth rate, not as the actual return earned every year.
- Compare CAGR only with appropriate benchmarks and comparable periods.
- Consider risk and volatility separately.
The calculator requires an initial value, final value, and positive time period before it performs the calculation.
Common CAGR Calculation Mistakes
Using the Total Return as the CAGR
A 100% total return does not mean a 100% CAGR.
The time period must be included.
Ignoring the Number of Years
The same beginning and ending values can produce very different CAGR results depending on whether the growth occurred over three, five, ten, or twenty years.
Treating CAGR as Actual Annual Performance
CAGR is a smoothed equivalent rate. It does not prove that the investment earned the same percentage every year.
Using Simple Average Returns
Arithmetic averaging does not generally capture the effect of compounding.
Ignoring Cash Flows
Additional deposits and withdrawals can make a simple beginning-to-ending CAGR inappropriate for measuring underlying investment performance.
Comparing Incompatible Metrics
A revenue CAGR should not automatically be compared with a stock-price CAGR or a total shareholder return CAGR.
The underlying metric needs to be consistent.
Quick CAGR Reference Table
| Question | Answer |
|---|---|
| What does CAGR stand for? | Compound Annual Growth Rate |
| What does CAGR measure? | Annualized compounded growth over a specified period |
| What inputs are required? | Initial value, final value, and number of years |
| Main formula | (Final Value ÷ Initial Value)^(1 ÷ Years) − 1 |
| Is CAGR the actual return each year? | No |
| Can CAGR be negative? | Yes |
| Can CAGR be zero? | Yes, when beginning and ending values are equal |
| Can CAGR be used for businesses? | Yes |
| Can CAGR be used for investments? | Yes |
| Does CAGR measure risk? | No |
| Does CAGR show volatility? | No |
| Does CAGR account automatically for cash deposits? | No |
| Can CAGR be calculated in Excel? | Yes |
| Can CAGR be calculated in Google Sheets? | Yes |
Frequently Asked Questions About CAGR
How do you calculate CAGR?
Use:
CAGR = (Final Value ÷ Initial Value)^(1 ÷ Years) − 1
Multiply the answer by 100 to express it as a percentage.
What is a good CAGR?
There is no universal definition of a good CAGR. The appropriate benchmark depends on the investment, risk, time period, market conditions, costs, taxes, and objective.
Investor.gov notes that historical long-term diversified U.S. stock returns are sometimes estimated in the 7%–10% annual range, but also stresses that investments do not have a guaranteed rate of return.
Is 12% CAGR good?
A 12% CAGR can represent strong growth, but it should be evaluated against a suitable benchmark and the risk taken to achieve it. It should not be interpreted as a guaranteed future rate.
Is 30% CAGR good?
A 30% CAGR is a very high growth rate mathematically. Whether it represents a good investment depends on how the return was achieved, the level of risk, the sustainability of the underlying growth, and the relevant benchmark.
How do I calculate CAGR in Excel?
Use:
=(Final Value / Initial Value)^(1 / Years)-1
Then format the result as a percentage.
What is the difference between CAGR and annual return?
An annual return describes performance over an individual year. CAGR describes the constant annual compounded rate that mathematically connects the beginning and ending values across multiple years.
Investor.gov defines annual return as the profit or loss on an investment over a one-year period.
What is the difference between CAGR and average annual return?
An average annual return can refer to an arithmetic average of annual returns, whereas CAGR incorporates compounding between the beginning and ending values.
The two measures can be substantially different when annual returns fluctuate.
Can CAGR be negative?
Yes. If the final value is below the initial value, the CAGR will generally be negative.
Can CAGR be used for revenue?
Yes. CAGR is commonly used to summarize multi-year growth in revenue, earnings, customers, assets, and other business metrics. SEC-filed corporate materials regularly use CAGR to describe multi-year growth measures.
Does CAGR include dividends?
Only if the beginning and ending values used in the calculation incorporate the relevant dividend distributions. Always verify whether the values represent price performance or total returns.
Does CAGR account for inflation?
Not automatically. A conventional CAGR calculation reflects the values supplied. A separate inflation adjustment is needed to analyze real purchasing-power growth.
The Most Important Things to Remember About CAGR
CAGR is best understood as a summary measure of compounded growth.
It takes three key pieces of information:
Initial Value + Final Value + Time
and converts them into one annualized growth figure.
The core formula is:
CAGR = (Final Value ÷ Initial Value)^(1 ÷ Years) − 1
CAGR is useful because it makes growth over different time periods easier to compare. It can be applied to investments, revenue, market sizes, customer counts, assets, and many other quantities.
At the same time, CAGR has clear limitations. It does not reveal the actual sequence of yearly returns, volatility, drawdowns, risk, or the effect of interim cash flows. A high CAGR is not automatically a good investment outcome, and a low CAGR is not automatically bad.
The most useful way to interpret CAGR is therefore to combine it with the time period, underlying values, risk, benchmark, fees, taxes, inflation, and the actual path of performance.
Authoritative Sources for Understanding CAGR
Investor.gov — U.S. Securities and Exchange Commission
Investor.gov’s official glossary provides a definition of Compound Annual Growth Rate, while its investor education materials explain compound growth and investment returns.
U.S. Securities and Exchange Commission
SEC-filed corporate disclosures regularly use CAGR as a measure of multi-year growth, including revenue, earnings, dividends, and shareholder returns.
These official sources provide a strong foundation for explaining CAGR because they distinguish annual returns, compound growth, and multi-year annualized growth rather than treating all percentage returns as interchangeable.
Sources
Investor.gov, U.S. Securities and Exchange Commission — Compound Annual Growth Rate glossary.
Investor.gov, U.S. Securities and Exchange Commission — Introduction to Investing and compound growth.
Investor.gov, U.S. Securities and Exchange Commission — Annual Return glossary.
Free CAGR Calculator Excel Template
Want to calculate CAGR in Excel? Download our free CAGR Calculator Excel template to quickly calculate Compound Annual Growth Rate, total return, and profit or loss.
Download the Free CAGR Calculator Excel Template
Simply enter your initial value, final value, and number of years to calculate your CAGR automatically.