Run Profitability Ratios Calculator
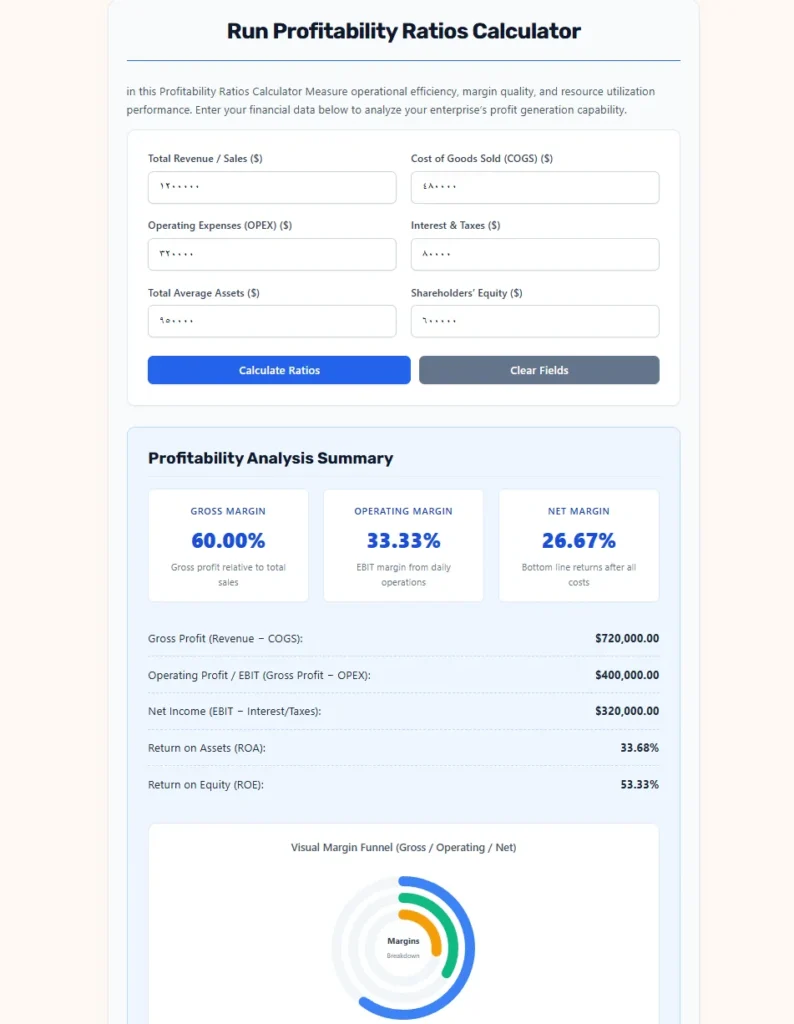
in this Profitability Ratios Calculator Measure operational efficiency, margin quality, and resource utilization performance. Enter your financial data below to analyze your enterprise’s profit generation capability.
Profitability Equations Explained
Fundamental Performance Ratios
Understanding margins and capital productivity helps assess if a firm can convert investments and top-line sales into cash flow effectively:
Gross Profit Margin: The percentage of sales left after subtracting directly related costs of production.
Gross Margin = (Gross Profit ÷ Total Revenue) × 100
Operating Profit Margin: Reflects administrative and distribution efficiency before financial structure expenses.
Operating Margin = (Operating Profit (EBIT) ÷ Total Revenue) × 100
Net Profit Margin: The bottom line indicator of overall profitability, including financing structures and tax effects.
Net Margin = (Net Income ÷ Total Revenue) × 100
Return on Assets (ROA): Indicates how efficiently management employs capital assets to generate return.
ROA = (Net Income ÷ Total Average Assets) × 100
Return on Equity (ROE): Measures the profit generated per dollar of investment contributed by shareholders.
ROE = (Net Income ÷ Shareholders’ Equity) × 100
Benchmark Guide
Evaluating Performance and Health
- Gross Margin: Heavily industry-dependent. Software often achieves 80%+, whereas grocery retail averages 15% to 25%.
- Operating Margin: High values suggest strong operational cost control, leverage, and pricing power.
- ROA / ROE: Generally, a ROA higher than 5% and ROE higher than 15% indicate strong corporate productivity and solid managerial health.
Corporate Profitability Ratios: An Analytical Framework for Financial Diagnostics
In corporate finance, measuring profitability is far more complex than tracking absolute dollar gains. Profitability ratios serve as relative metrics that standardize financial performance against baseline sales, operating costs, total balance sheet assets, and shareholder investments. This normalization enables financial analysts, startup founders, institutional investors, and operations executives to evaluate and contrast different organizational structures objectively.
Whether evaluating a local manufacturing plant or a multinational enterprise, profitability ratios reveal how efficiently corporate structures convert operational activity into monetary surplus. Standardizing financial inputs through ratio analysis provides a systematic process to evaluate the fundamental components of an income statement and balance sheet.
Introduction to Profitability Analysis
Before executing calculations, it is critical to separate absolute financial metrics from ratio analysis. While absolute metrics like net income or gross sales show scale, they fail to demonstrate efficiency. For instance, a firm that generates $\$1,000,000$ in net income on $\$10,000,000$ in total sales operates at a $10\%$ net margin. Conversely, a smaller competitor generating $\$200,000$ in net income on $\$1,000,000$ in total sales operates at a $20\%$ net margin. The smaller competitor is twice as efficient at transforming sales activities into net returns.
Profitability ratios are generally split into two categories:
$\checkmark$ Margin-based Ratios: These measure how effectively a company manages its expenses relative to its total top-line sales, including gross margin, operating margin, and net profit margin.
$\checkmark$ Return-based Ratios: These assess how efficiently a business converts resource bases, like total assets and equity reserves, into bottom-line returns, including Return on Assets (ROA) and Return on Equity (ROE).
Understanding the Accrual Foundation of Profitability
To build a reliable diagnostic model, one must understand that profitability ratios are calculated from accrual-based financial statements, rather than cash flow statements. Under accrual accounting, revenues are recognized when earned, and expenses are matched when incurred, regardless of when cash changes hands.
This leads to several critical financial realities:
- Profitability is Not Cash Flow: A highly profitable company can still face severe cash shortages if its working capital is tied up in inventory or accounts receivable.
- The Matching Principle: Expenses directly associated with producing revenue must be recorded in the same period as that revenue, which ensures that gross and operating margins accurately reflect operational performance during that timeframe.
- Non-Cash Adjustments: Amortization and depreciation represent non-cash expenses that reduce operating profit metrics without directly draining corporate cash reserves.
By looking at margins rather than pure cash balances, management can determine whether their pricing strategies, product delivery mechanisms, and administrative structures are fundamentally viable.
The Six Fundamental Variables of Profitability Modeling
To run diagnostic evaluations, an analyst must extract six specific variables from a company’s income statement and balance sheet. Understanding the accounting logic of each parameter ensures correct data entry and interpretation.
1. Total Revenue
Also referred to as gross sales or the top line, this figure represents the cumulative dollar amount of products sold or services rendered before any discounts, returns, or expenses are deducted.
2. Cost of Goods Sold (COGS)
This represents the direct expenses incurred to manufacture products or deliver services. It includes raw materials, direct factory labor, and manufacturing overhead. COGS is the primary driver of production efficiency.
3. Operating Expenses (OPEX)
These are the indirect expenses necessary to maintain daily operations. They include sales and marketing, research and development (R&D), general administrative salaries, office rent, and utility bills. OPEX measures corporate overhead control.
4. Interest and Taxes
These represent financial structure expenses (the cost of carrying debt) and government obligations. Keeping these separate from operating costs allows analysts to evaluate core operating performance independently of financing and tax structures.
5. Total Average Assets
Assets represent everything a company owns or controls to generate economic value. Rather than using the ending balance sheet asset figure, analysts use the average of the beginning and ending assets for the period. This ensures that the asset base matches the period of revenue generation.
6. Shareholders’ Equity
This is the net book value of the enterprise, calculated as total assets minus total liabilities. Shareholders’ equity represents the owners’ net investment in the business, consisting of contributed capital plus accumulated retained earnings.
Mathematical Formulations of Margin-Based Ratios
To ensure these equations are highly readable on both desktop and mobile layouts, all formulations have been broken down into simplified, narrow variables.
1. Gross Profit Margin (GPM)
The gross margin evaluates direct production cost efficiency. It measures what portion of revenue remains to cover operating overhead, debt obligations, and shareholder returns after accounting for manufacturing costs.
To calculate this, we first establish the value of Gross Profit ($\text{GP}$):$$\text{GP} = \text{TR} – \text{COGS}$$
Using the resulting $\text{GP}$ value, the Gross Profit Margin ($\text{GPM}$) is expressed as:$$\text{GPM} = \left( \frac{\text{GP}}{\text{TR}} \right) \times 100$$
Where:
- $\rightarrow$ $\text{GPM}$ represents the Gross Profit Margin (expressed as a percentage).
- $\rightarrow$ $\text{GP}$ represents the Gross Profit (calculated as Total Revenue minus COGS).
- $\rightarrow$ $\text{TR}$ represents the Total Revenue of the period.
- $\rightarrow$ $\text{COGS}$ represents the Cost of Goods Sold.
2. Operating Profit Margin (OPM)
The operating profit margin, or Earnings Before Interest and Taxes (EBIT) margin, filters out financing structures and tax jurisdictions. This highlights how efficiently management runs the day-to-day core business.
To calculate this, we first establish the value of Operating Profit ($\text{OP}$):$$\text{OP} = \text{GP} – \text{OPEX}$$
Using the resulting $\text{OP}$ value, the Operating Profit Margin ($\text{OPM}$) is calculated as:$$\text{OPM} = \left( \frac{\text{OP}}{\text{TR}} \right) \times 100$$
Where:
- $\rightarrow$ $\text{OPM}$ represents the Operating Profit Margin (expressed as a percentage).
- $\rightarrow$ $\text{OP}$ represents the Operating Profit or Earnings Before Interest and Taxes (EBIT).
- $\rightarrow$ $\text{GP}$ represents the Gross Profit.
- $\rightarrow$ $\text{OPEX}$ represents the Operating Expenses.
- $\rightarrow$ $\text{TR}$ represents the Total Revenue.
3. Net Profit Margin (NPM)
The ultimate bottom-line benchmark. This metric factors in all operational costs, interest charges, depreciation, tax fees, and non-operating activities to show what percentage of sales actually becomes profit for the owners.
To calculate this, we first establish the value of Net Income ($\text{NI}$):$$\text{NI} = \text{OP} – \text{IT}$$
Using the resulting $\text{NI}$ value, the Net Profit Margin ($\text{NPM}$) is calculated as:$$\text{NPM} = \left( \frac{\text{NI}}{\text{TR}} \right) \times 100$$
Where:
- $\rightarrow$ $\text{NPM}$ represents the Net Profit Margin (expressed as a percentage).
- $\rightarrow$ $\text{NI}$ represents the Net Income or bottom-line earnings.
- $\rightarrow$ $\text{OP}$ represents the Operating Profit (EBIT).
- $\rightarrow$ $\text{IT}$ represents the Interest and Taxes.
- $\rightarrow$ $\text{TR}$ represents the Total Revenue.
Mathematical Formulations of Return-Based Ratios
While margins focus on performance relative to sales volumes, return-based ratios evaluate how productively a company uses its balance sheet capital.
1. Return on Assets (ROA)
The ROA evaluates how efficiently management uses its asset base, such as plants, properties, equipment, cash, and inventories, to generate profits.
The equation is:$$\text{ROA} = \left( \frac{\text{NI}}{\text{TA}} \right) \times 100$$
Where:
- $\rightarrow$ $\text{ROA}$ represents the Return on Assets (expressed as a percentage).
- $\rightarrow$ $\text{NI}$ represents the Net Income.
- $\rightarrow$ $\text{TA}$ represents the Total Average Assets for the period.
2. Return on Equity (ROE)
This ratio measures the rate of return on the capital invested by shareholders, showing how effectively management reinvests owner capital to generate wealth.
The equation is:$$\text{ROE} = \left( \frac{\text{NI}}{\text{SE}} \right) \times 100$$
Where:
- $\rightarrow$ $\text{ROE}$ represents the Return on Equity (expressed as a percentage).
- $\rightarrow$ $\text{NI}$ represents the Net Income.
- $\rightarrow$ $\text{SE}$ represents the Shareholders’ Equity.
Advanced Analytical Diagnostics: The DuPont System
A high Return on Equity ($\text{ROE}$) is generally positive, but it can sometimes hide structural issues, such as taking on too much debt. To prevent misleading conclusions, financial analysts use the DuPont System. This system breaks $\text{ROE}$ down into three separate levers: margin, turnover, and leverage.
The DuPont equation is structured as follows:$$\text{ROE} = \text{NPM} \times \text{ATO} \times \text{EM}$$
By breaking down the ratios, we can analyze each component individually:
Lever 1: Net Profit Margin (NPM)
Measures operational efficiency and pricing strategy.$$\text{NPM} = \frac{\text{NI}}{\text{TR}}$$
Where:
- $\rightarrow$ $\text{NI}$ is Net Income.
- $\rightarrow$ $\text{TR}$ is Total Revenue.
Lever 2: Asset Turnover Ratio (ATO)
Measures how efficiently the company uses its assets to generate sales.$$\text{ATO} = \frac{\text{TR}}{\text{TA}}$$
Where:
- $\rightarrow$ $\text{TR}$ is Total Revenue.
- $\rightarrow$ $\text{TA}$ is Total Average Assets.
Lever 3: Equity Multiplier (EM)
Measures financial leverage, indicating how much of the asset base is financed by debt versus equity.$$\text{EM} = \frac{\text{TA}}{\text{SE}}$$
Where:
- $\rightarrow$ $\text{TA}$ is Total Average Assets.
- $\rightarrow$ $\text{SE}$ is Shareholders’ Equity.
Diagnostic Interpretation Matrix
Understanding how these three levers interact helps identify why a company’s financial performance changes over time:
- High Margin, Low Turnover, Low Leverage: Typical of premium luxury brands or high-growth SaaS firms. They rely on strong brand equity and pricing power rather than high sales volumes.
- Low Margin, High Turnover, Low Leverage: Typical of supermarkets and grocery stores. They operate on tiny margins but move inventory quickly, keeping debt levels low.
- Low Margin, Low Turnover, High Leverage: Typical of asset-heavy utilities or infrastructure companies. They use debt to build massive infrastructure projects that generate steady, long-term revenues.
Sector Benchmarks and Comparative Analysis
Comparing profitability ratios across different industries can lead to incorrect conclusions. A retail business with a $3\%$ net profit margin can be highly successful, while a software company with the same margin would likely be struggling due to high development costs.
| Industry Sector | Average Gross Margin | Average Operating Margin | Average Net Margin | Typical Target ROA | Typical Target ROE |
| Enterprise Software (SaaS) | $70\% – 85\%$ | $15\% – 25\%$ | $10\% – 20\%$ | $8\% – 12\%$ | $15\% – 25\%$ |
| Grocery and Supermarkets | $15\% – 22\%$ | $2\% – 5\%$ | $1\% – 3\%$ | $4\% – 7\%$ | $12\% – 18\%$ |
| Heavy Manufacturing | $25\% – 40\%$ | $8\% – 15\%$ | $5\% – 10\%$ | $5\% – 8\%$ | $10\% – 15\%$ |
| Healthcare and Biotech | $45\% – 60\%$ | $10\% – 18\%$ | $6\% – 12\%$ | $6\% – 10\%$ | $12\% – 20\%$ |
| Public Utilities | $35\% – 50\%$ | $12\% – 20\%$ | $8\% – 15\%$ | $2\% – 5\%$ | $8\% – 12\%$ |
Real-World Comparative Examples
To see how these concepts work in practice, let us look at two different business models: a high-margin enterprise software firm and a low-margin, high-volume retail boutique.
Case Study A: PeakScale Software Inc.
PeakScale Software has excellent profit margins but requires a larger asset and equity base to fund ongoing development and scale operations.
- $\rightarrow$ $\text{Total Revenue (TR)} = \$12,000,000$
- $\rightarrow$ $\text{Cost of Goods Sold (COGS)} = \$1,800,000$
- $\rightarrow$ $\text{Operating Expenses (OPEX)} = \$6,200,000$
- $\rightarrow$ $\text{Interest and Taxes (IT)} = \$800,000$
- $\rightarrow$ $\text{Total Average Assets (TA)} = \$15,000,000$
- $\rightarrow$ $\text{Shareholders’ Equity (SE)} = \$10,000,000$
Step 1: Calculate Margins
- $\text{Gross Profit (GP)} = \$12,000,000 – \$1,800,000 = \$10,200,000$
$$\text{GPM} = \left( \frac{10,200,000}{12,000,000} \right) \times 100 = 85.00\%$$
- $\text{Operating Profit (OP)} = \$10,200,000 – \$6,200,000 = \$4,000,000$
$$\text{OPM} = \left( \frac{4,000,000}{12,000,000} \right) \times 100 = 33.33\%$$
- $\text{Net Income (NI)} = \$4,000,000 – \$800,000 = \$3,200,000$
$$\text{NPM} = \left( \frac{3,200,000}{12,000,000} \right) \times 100 = 26.67\%$$
Step 2: Calculate Returns$$\text{ROA} = \left( \frac{3,200,000}{15,000,000} \right) \times 100 = 21.33\%$$$$\text{ROE} = \left( \frac{3,200,000}{10,000,000} \right) \times 100 = 32.00\%$$
PeakScale shows high margins and strong efficiency, resulting in a robust Return on Assets ($21.33\%$) and Return on Equity ($32.00\%$).
Case Study B: Urban Thread Boutique
Urban Thread Boutique operates with lower margins due to inventory costs and retail rent, but uses a highly capital-efficient asset base.
- $\rightarrow$ $\text{Total Revenue (TR)} = \$1,500,000$
- $\rightarrow$ $\text{Cost of Goods Sold (COGS)} = \$900,000$
- $\rightarrow$ $\text{Operating Expenses (OPEX)} = \$420,000$
- $\rightarrow$ $\text{Interest and Taxes (IT)} = \$30,000$
- $\rightarrow$ $\text{Total Average Assets (TA)} = \$600,000$
- $\rightarrow$ $\text{Shareholders’ Equity (SE)} = \$250,000$
Step 1: Calculate Margins
- $\text{Gross Profit (GP)} = \$1,500,000 – \$900,000 = \$600,000$
$$\text{GPM} = \left( \frac{600,000}{1,500,000} \right) \times 100 = 40.00\%$$
- $\text{Operating Profit (OP)} = \$600,000 – \$420,000 = \$180,000$
$$\text{OPM} = \left( \frac{180,000}{1,500,000} \right) \times 100 = 12.00\%$$
- $\text{Net Income (NI)} = \$180,000 – \$30,000 = \$150,000$
$$\text{NPM} = \left( \frac{150,000}{1,500,000} \right) \times 100 = 10.00\%$$
Step 2: Calculate Returns$$\text{ROA} = \left( \frac{150,000}{600,000} \right) \times 100 = 25.00\%$$$$\text{ROE} = \left( \frac{150,000}{250,000} \right) \times 100 = 60.00\%$$
Strategic Takeaway: Even though PeakScale Software has a much higher net profit margin ($26.67\%$ vs. $10.00\%$), Urban Thread Boutique generates a higher Return on Equity ($60.00\%$ vs. $32.00\%$).
By turning over inventory quickly and keeping its asset base lean, the boutique generates more profit per dollar of shareholder investment, proving that low-margin businesses can still be highly capital-efficient.
Best Practices for Ratio Optimization
Improving your company’s profitability ratios requires a structured approach to managing both your income statement and your balance sheet:
- Optimize Cost of Goods Sold: Review supplier contracts, purchase materials in bulk, or automate assembly steps to lower manufacturing costs and expand your Gross Profit Margin.
- Streamline Operating Expenses: Automate administrative tasks and scale back non-essential services to ensure sales growth outpaces overhead expenses, boosting your Operating Margin.
- Improve Asset Efficiency: Sell underutilized equipment and optimize inventory levels to increase your Asset Turnover Ratio, which directly improves Return on Assets.
- Manage Your Capital Structure: Use debt carefully to optimize your financing mix. This can increase Return on Equity without taking on too much financial risk.
Academic References and Foundations
This guide is built on the core financial theories and practices outlined in:
- Brigham, E. F., & Ehrhardt, M. C. (2016). Financial Management: Theory & Practice. Cengage Learning.
- For additional guidance on analyzing financial disclosures, visit the US Securities and Exchange Commission (SEC) guidelines.