Run Profit Margin Calculator
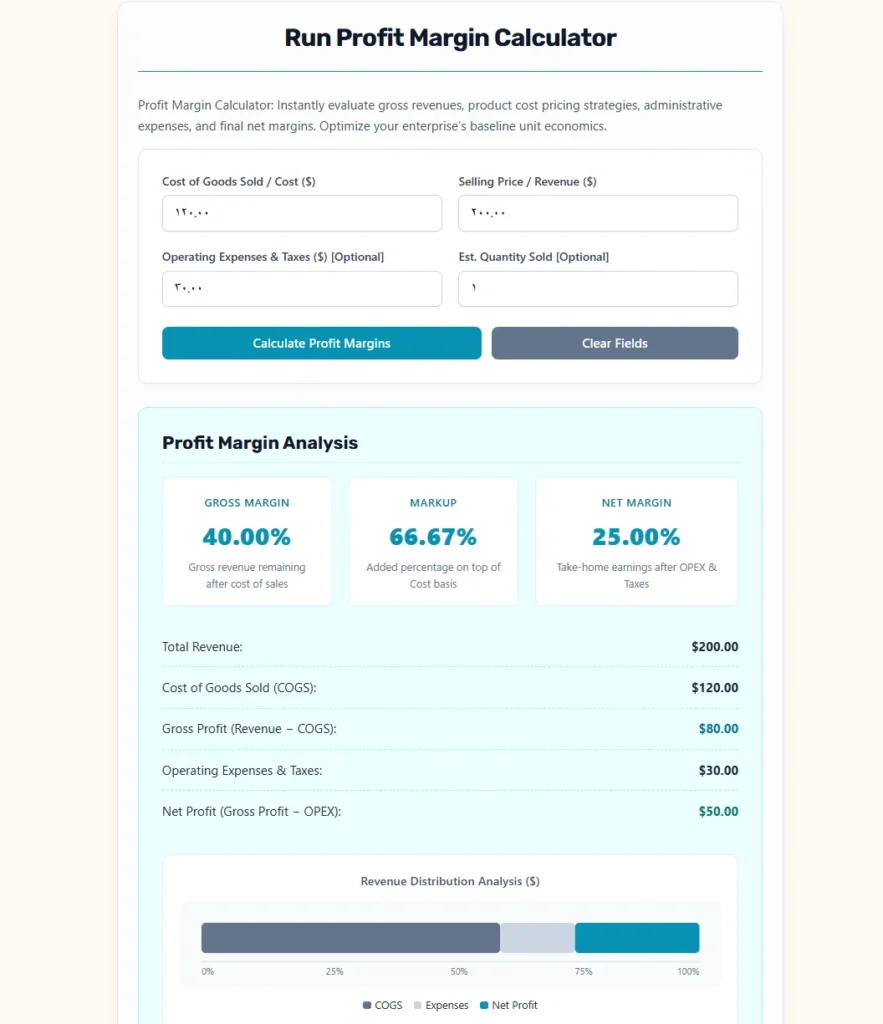
Profit Margin Calculator: Instantly evaluate gross revenues, product cost pricing strategies, administrative expenses, and final net margins. Optimize your enterprise’s baseline unit economics.
Profit Margin Formulas Explained
Fundamental Financial Math (HTML5)
Evaluating the distinction between margins and markups is crucial for accurate sales pricing. These equations dictate core performance:
Gross Profit Margin: The percentage of selling price that remains as profit after accounting for product costs.
Gross Margin = ((Selling Price − COGS) ÷ Selling Price) × 100
Markup Percentage: The percentage markup added directly to your unit cost base to achieve a target selling price.
Markup = ((Selling Price − COGS) ÷ COGS) × 100
Net Profit Margin: The final operational conversion rate demonstrating pure performance after subtracting both directly related sales costs and peripheral operating overheads.
Net Margin = ((Gross Profit − Operating Expenses) ÷ Selling Price) × 100
Financial Benchmarks
Quick Margin Guide
- Gross Margin (COGS dependent): Varies widely. Product-based retail typically targets 50%+, digital services target 80%+, and heavy manufacturing averages 20%-35%.
- Markup vs Margin: A 100% markup corresponds to a 50% profit margin. Ensure you do not mistake markup rules for margin targets during pricing runs.
- Net Margin Thresholds: Real enterprise standard performance dictates that 20%+ is considered high, 10% is healthy, and below 5% represents tight margins.
Corporate Profit Margin Analysis: Principles, Formulations, and Strategic Pricing Frameworks
In the management of modern corporate enterprises, maintaining a rigorous understanding of unit economics serves as the foundation for long-term viability. While top-line sales figures and gross transaction volumes indicate market scale, they fail to demonstrate financial sustainability. To gauge the true operational health of an enterprise, financial executives, corporate treasurers, and investors look to profit margin ratios.
Profit margin analysis is a financial tool that translates raw balance sheets and income statement numbers into standardized percentages. This process allows analysts to compare companies of different scales, evaluate product pricing strategies, track operational efficiencies, and assess capital allocation over time. This guide explores the mathematical foundations, core strategic applications, and industry benchmarks of unit profit margins.
Understanding the Strategic Importance of Profit Margins
Profit margins provide direct insight into how effectively a business converts sales revenue into actual profit. Without normalized ratios, assessing performance across different business models is highly challenging. For example, a global corporation with high revenues may operate on thin margins, leaving it vulnerable to sudden shifts in the market. Conversely, a smaller, leaner company with lower revenues may operate on high margins, providing greater resilience to economic downturns.
Analyzing margins regularly allows management teams to perform critical corporate tasks:
$\checkmark$ Assess Pricing Power: High margins often indicate strong brand value, technological advantages, or proprietary market positioning that allows a firm to charge premium prices.
$\checkmark$ Control Operational Leakage: Lowering operating margins over time can alert managers to rising administrative costs, inefficient supply chains, or increasing direct material costs.
$\checkmark$ Establish Investor Valuation: Venture capitalists, investment bankers, and public market investors rely heavily on gross and net margin trends to calculate enterprise value and estimate future cash flows.
The Crucial Distinction Between Margin and Markup
A common operational error made by business owners and marketing executives is confusing markup with profit margin. While both metrics evaluate the relationship between direct production costs and final retail prices, they use different denominators. This mathematical difference leads to completely different percentage values.
1. Profit Margin Deconstructed
Profit margin measures the relationship between profit and selling price, showing what percentage of the final retail price is retained as profit.
2. Markup Percentage Deconstructed
Markup measures the relationship between profit and cost, indicating the percentage added to the wholesale or direct production cost to determine the final retail price.
The table below illustrates the math behind this relationship, showing how specific markup percentages translate to corresponding profit margins.
| Unit Wholesale Cost ($) | Target Selling Price ($) | Calculated Markup Percentage | Resulting Gross Margin Percentage |
| $\$100.00$ | $\$125.00$ | $25.00\%$ | $20.00\%$ |
| $\$100.00$ | $\$150.00$ | $50.00\%$ | $33.33\%$ |
| $\$100.00$ | $\$200.00$ | $100.00\%$ | $50.00\%$ |
| $\$100.00$ | $\$300.00$ | $200.00\%$ | $66.67\%$ |
| $\$100.00$ | $\$400.00$ | $300.00\%$ | $75.00\%$ |
| $\$100.00$ | $\$500.00$ | $400.00\%$ | $80.00\%$ |
The Margin-Markup Conversion Equations
To convert markup directly to gross margin or vice versa, analysts use simplified mathematical formulas.
To find the gross margin percentage ($\text{M}$) from a known markup percentage ($\text{U}$):$$\text{M} = \frac{\text{U}}{1 + \text{U}}$$
Where:
- $\rightarrow$ $\text{M}$ represents the profit margin expressed as a decimal value.
- $\rightarrow$ $\text{U}$ represents the markup percentage expressed as a decimal value.
To find the markup percentage ($\text{U}$) from a known gross margin percentage ($\text{M}$):$$\text{U} = \frac{\text{M}}{1 – \text{M}}$$
Where:
- $\rightarrow$ $\text{U}$ represents the markup percentage expressed as a decimal value.
- $\rightarrow$ $\text{M}$ represents the profit margin expressed as a decimal value.
Deconstructing Unit Economics: The Input Parameters
To utilize a profit margin model, a financial analyst must understand the four primary operational variables.
1. Cost of Goods Sold (COGS)
Often referred to directly as unit cost, COGS represents the cumulative direct expenses required to produce a physical good or deliver a specific service. This variable includes:
- Direct raw materials and inventory sourcing fees.
- Factory assembly wages and labor overhead.
- Freight-in costs for receiving production inventory.
- Direct manufacturing equipment utilities.
2. Selling Price
The selling price represents the gross revenue generated per unit sold, reflecting the final price paid by the customer. It is the core driver of the top-line revenue on a company’s income statement.
3. Operating Expenses and Taxes (OPEX)
These represent indirect expenses that are not tied to a single unit of production but are necessary to keep the business running. They include:
- Sales and marketing, corporate advertising, and affiliate commissions.
- Office rent, administrative salaries, and corporate software tools.
- Income taxes, local asset taxes, and interest expenses on commercial debt.
4. Estimated Quantity (Units Sold)
The volume of units expected to be sold during a given period. This value allows the model to scale from individual unit economics to aggregate quarterly or annual profit performance.
The Mathematical Architecture of Profit Margins
To ensure clear display on mobile devices, tablets, and small screen containers, these equations are broken down into narrow, stacked steps.
Gross Profit Metric
Gross profit represents the money a business has left after subtracting direct production costs from revenue, but before accounting for any general overhead, administrative costs, interest, or taxes.
At the individual unit level:$$\text{GP} = \text{SP} – \text{UC}$$
Where:
- $\rightarrow$ $\text{GP}$ represents the Gross Profit per unit.
- $\rightarrow$ $\text{SP}$ represents the unit Selling Price.
- $\rightarrow$ $\text{UC}$ represents the direct Unit Cost (COGS).
At the aggregate volume level:$$\text{TGP} = \text{GP} \times \text{Q}$$
Where:
- $\rightarrow$ $\text{TGP}$ represents the Total Gross Profit.
- $\rightarrow$ $\text{GP}$ represents the Gross Profit per unit.
- $\rightarrow$ $\text{Q}$ represents the aggregate Quantity of units sold.
Gross Profit Margin Percentage
Gross profit margin measures direct production efficiency, showing what percentage of every dollar of sales revenue remains after paying for raw materials and direct labor.$$\text{GPM} = \frac{\text{GP}}{\text{SP}} \times 100$$
Where:
- $\rightarrow$ $\text{GPM}$ represents the Gross Profit Margin percentage.
- $\rightarrow$ $\text{GP}$ represents the Unit Gross Profit.
- $\rightarrow$ $\text{SP}$ represents the Unit Selling Price.
Markup Percentage
Markup measures the percentage increase added to the cost of a product to determine its final selling price.$$\text{MU} = \frac{\text{GP}}{\text{UC}} \times 100$$
Where:
- $\rightarrow$ $\text{MU}$ represents the Markup Percentage.
- $\rightarrow$ $\text{GP}$ represents the Unit Gross Profit.
- $\rightarrow$ $\text{UC}$ represents the Unit Cost (COGS).
Net Profit Metric
Net profit, or the bottom line, represents the actual profit a business has left over after paying all operating expenses, administrative costs, marketing fees, interest payments, and taxes.
At the individual unit level:$$\text{NP} = \text{GP} – \text{OE}$$
Where:
- $\rightarrow$ $\text{NP}$ represents the Net Profit per unit.
- $\rightarrow$ $\text{GP}$ represents the Gross Profit per unit.
- $\rightarrow$ $\text{OE}$ represents the Operating Expenses and taxes allocated per unit.
At the aggregate volume level:$$\text{TNP} = \text{NP} \times \text{Q}$$
Where:
- $\rightarrow$ $\text{TNP}$ represents the Total Net Profit.
- $\rightarrow$ $\text{NP}$ represents the Net Profit per unit.
- $\rightarrow$ $\text{Q}$ represents the aggregate Quantity of units sold.
Net Profit Margin Percentage
The net profit margin shows the overall profitability of a business, measuring what percentage of every dollar of sales revenue actually becomes net income for the owners after all expenses are paid.$$\text{NPM} = \frac{\text{NP}}{\text{SP}} \times 100$$
Where:
- $\rightarrow$ $\text{NPM}$ represents the Net Profit Margin percentage.
- $\rightarrow$ $\text{NP}$ represents the Net Profit per unit.
- $\rightarrow$ $\text{SP}$ represents the Unit Selling Price.
Industry Benchmarks and Sector Analysis
Different industries operate under distinct economic structures, meaning target profit margins vary widely across sectors. A high-volume business like grocery retail can be highly successful with low margins, whereas a software company requires much higher margins to cover its development costs.
The table below outlines typical ranges for gross margins, markup percentages, and net margins across key industries.
| Industry Classification | Average Gross Margin | Average Markup Range | Average Net Margin | Key Margin Cost Drivers |
| Enterprise Software (SaaS) | $75\% – 90\%$ | $300\% – 900\%$ | $15\% – 25\%$ | Cloud infrastructure, R&D, sales commissions |
| Restaurant & Food Service | $60\% – 70\%$ | $150\% – 233\%$ | $3\% – 8\%$ | Raw food spoilage, kitchen labor, utilities |
| Retail Grocery Chains | $15\% – 25\%$ | $17\% – 33\%$ | $1\% – 3\%$ | Shipping and logistics, inventory turnover, spoilage |
| Heavy Manufacturing | $25\% – 40\%$ | $33\% – 67\%$ | $6\% – 12\%$ | Raw materials, industrial energy, factory labor |
| Consulting & Services | $50\% – 70\%$ | $100\% – 233\%$ | $10\% – 20\%$ | Professional labor, software tools, marketing |
Real-World Operational Scenarios
To see how these margin concepts apply in real-world business models, we can analyze two detailed operational scenarios: an enterprise hardware manufacturer and a high-volume apparel brand.
Scenario A: High-Definition Commercial Hardware Manufacturer
This business manufactures specialized, low-volume office equipment with premium pricing.
- $\rightarrow$ Unit Cost ($\text{UC}$) = $\$450.00$
- $\rightarrow$ Unit Selling Price ($\text{SP}$) = $\$1,200.00$
- $\rightarrow$ Unit Operating Expenses ($\text{OE}$) = $\$350.00$
- $\rightarrow$ Quantity expected to be sold ($\text{Q}$) = $250$ units
We apply the formulas to find the unit economics:$$\text{GP} = \text{SP} – \text{UC}$$$$\text{GP} = 1,200.00 – 450.00$$$$\text{GP} = 750.00$$
Where:
- $\rightarrow$ $\text{GP}$ represents the Unit Gross Profit.
$$\text{GPM} = \frac{\text{GP}}{\text{SP}} \times 100$$$$\text{GPM} = \frac{750.00}{1,200.00} \times 100$$$$\text{GPM} = 62.50\%$$
Where:
- $\rightarrow$ $\text{GPM}$ represents the Gross Profit Margin percentage.
$$\text{MU} = \frac{\text{GP}}{\text{UC}} \times 100$$$$\text{MU} = \frac{750.00}{450.00} \times 100$$$$\text{MU} = 166.67\%$$
Where:
- $\rightarrow$ $\text{MU}$ represents the Markup Percentage.
Now, we calculate the bottom-line net profit metrics:$$\text{NP} = \text{GP} – \text{OE}$$$$\text{NP} = 750.00 – 350.00$$$$\text{NP} = 400.00$$
Where:
- $\rightarrow$ $\text{NP}$ represents the Net Profit per unit.
$$\text{NPM} = \frac{\text{NP}}{\text{SP}} \times 100$$$$\text{NPM} = \frac{400.00}{1,200.00} \times 100$$$$\text{NPM} = 33.33\%$$
Where:
- $\rightarrow$ $\text{NPM}$ represents the Net Profit Margin percentage.
At the scale of $250$ units, the aggregate financial output represents:$$\text{TGP} = \text{GP} \times \text{Q}$$$$\text{TGP} = 750.00 \times 250$$$$\text{TGP} = 187,500.00$$
Where:
- $\rightarrow$ $\text{TGP}$ represents the Total Gross Profit.
$$\text{TNP} = \text{NP} \times \text{Q}$$$$\text{TNP} = 400.00 \times 250$$$$\text{TNP} = 100,000.00$$
Where:
- $\rightarrow$ $\text{TNP}$ represents the Total Net Profit.
This scenario illustrates a classic high-margin business model. The company generates a strong gross margin of $62.50\%$, allowing it to cover its operating expenses and achieve a healthy net profit margin of $33.33\%$.
Scenario B: High-Volume E-Commerce Apparel Retailer
This business sells clothing online, operating with lower profit margins but relying on high transaction volumes to drive overall profitability.
- $\rightarrow$ Unit Cost ($\text{UC}$) = $\$14.00$
- $\rightarrow$ Unit Selling Price ($\text{SP}$) = $\$25.00$
- $\rightarrow$ Unit Operating Expenses ($\text{OE}$) = $\$8.00$
- $\rightarrow$ Quantity expected to be sold ($\text{Q}$) = $15,000$ units
We apply the formulas to find the unit economics:$$\text{GP} = \text{SP} – \text{UC}$$$$\text{GP} = 25.00 – 14.00$$$$\text{GP} = 11.00$$
Where:
- $\rightarrow$ $\text{GP}$ represents the Unit Gross Profit.
$$\text{GPM} = \frac{\text{GP}}{\text{SP}} \times 100$$$$\text{GPM} = \frac{11.00}{25.00} \times 100$$$$\text{GPM} = 44.00\%$$
Where:
- $\rightarrow$ $\text{GPM}$ represents the Gross Profit Margin percentage.
$$\text{MU} = \frac{\text{GP}}{\text{UC}} \times 100$$$$\text{MU} = \frac{11.00}{14.00} \times 100$$$$\text{MU} = 78.57\%$$
Where:
- $\rightarrow$ $\text{MU}$ represents the Markup Percentage.
Now, we calculate the bottom-line net profit metrics:$$\text{NP} = \text{GP} – \text{OE}$$$$\text{NP} = 11.00 – 8.00$$$$\text{NP} = 3.00$$
Where:
- $\rightarrow$ $\text{NP}$ represents the Net Profit per unit.
$$\text{NPM} = \frac{\text{NP}}{\text{SP}} \times 100$$$$\text{NPM} = \frac{3.00}{25.00} \times 100$$$$\text{NPM} = 12.00\%$$
Where:
- $\rightarrow$ $\text{NPM}$ represents the Net Profit Margin percentage.
At the scale of $15,000$ units, the aggregate financial output represents:$$\text{TGP} = \text{GP} \times \text{Q}$$$$\text{TGP} = 11.00 \times 15,000$$$$\text{TGP} = 165,000.00$$
Where:
- $\rightarrow$ $\text{TGP}$ represents the Total Gross Profit.
$$\text{TNP} = \text{NP} \times \text{Q}$$$$\text{TNP} = 3.00 \times 15,000$$$$\text{TNP} = 45,000.00$$
Where:
- $\rightarrow$ $\text{TNP}$ represents the Total Net Profit.
Strategic Review: This comparison illustrates how volume impacts overall profitability. While Scenario A enjoys much higher margins ($62.50\%$ gross and $33.33\%$ net), Scenario B still generates significant total profit ($\$45,000.00$ net) with a modest $12.00\%$ net profit margin by selling at a much higher volume ($15,000$ units).
Strategic Tactics for Margin Optimization
To systematically improve profit margins, corporate managers must address both operational efficiencies and pricing strategies.
1. Strategic Sourcing and Supply Chain Auditing
Gross margins can be improved by lowering Cost of Goods Sold. Businesses can achieve this by negotiating volume discounts with suppliers, reducing waste in manufacturing, or finding alternative raw material sources.
2. Optimization of Pricing Models
Increasing prices is one of the fastest ways to improve gross and net margins. However, managers must analyze price elasticity of demand to ensure that a higher price does not lead to a drop in sales volume that offsets the higher margins.
3. Streamlining Operational Overheads
Improving net margin requires controlling operating expenses. Businesses can lower overhead by automating repetitive administrative tasks, optimizing digital marketing spending, and negotiating better terms on leases and service agreements.
4. Managing Product and Service Mix
A business can shift its sales focus toward its highest-margin products. By prioritizing marketing spend on high-margin items and phasing out low-margin products, a company can improve its overall average profitability.
Academic Foundations and Industry References
This guide is built on the core financial principles and theories detailed in:
- Horngren, C. T., Datar, S. M., & Rajan, M. V. (2015). Horngren’s Cost Accounting: A Managerial Emphasis. Pearson.
- For official regulatory guidance on corporate financial reporting, refer to the Financial Accounting Standards Board (FASB) guidelines.