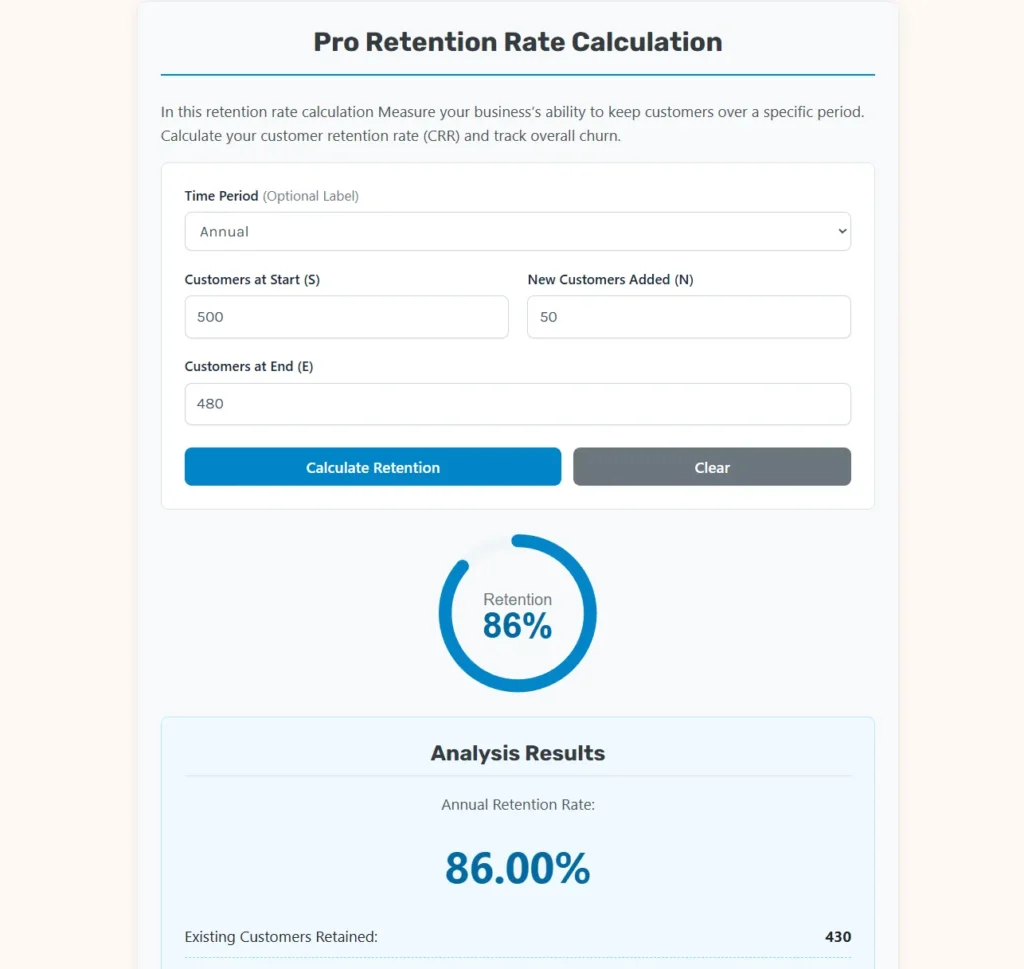
Pro Retention Rate Calculation
In this retention rate calculation Measure your business’s ability to keep customers over a specific period. Calculate your customer retention rate (CRR) and track overall churn.
Understanding Retention & Churn
The Standard Formula
Customer Retention Rate (CRR) measures the percentage of customers a company has retained over a given time period, explicitly excluding new customers acquired during that same period.
CRR = ((E − N) ÷ S) × 100
- E = Customers at the End of the period
- N = New customers acquired during the period
- S = Customers at the Start of the period
Why do we subtract new customers?
If you start with 100 customers, lose 20 of them, but gain 30 new ones, you end the period with 110 customers. If you only looked at the total count, it looks like 110% retention! By subtracting the 30 new customers (110 − 30 = 80), you accurately see that you retained 80 out of your original 100 customers (80% retention).
Strategic Mechanics of Customer Retention Rate and Churn Analysis
Acquisition is merely the beginning of the customer relationship. While securing new clients often receives the majority of marketing budgets, long-term enterprise viability is determined by an organization’s ability to retain its existing customer base. Customer retention serves as the primary engine for sustainable revenue growth, operating as an efficient stabilizer against market volatility.
The financial logic is straightforward. Acquiring a new customer is significantly more expensive than retaining an existing one, with industry estimates showing acquisition costs ranging from five to twenty-five times higher than retention costs. Furthermore, returning customers buy more frequently, spend more per transaction, and generate valuable organic referrals. Research published by Frederick Reichheld of Bain and Company indicates that a modest 5% increase in customer retention can boost corporate profits by 25% to 95%.
Acquisition Cost (High) → Conversion (One-time) → Retention Loop (Compounding Value)
To optimize this cycle, businesses must move away from guesswork and adopt precise quantitative measurements. The Pro Retention Rate Calculation tool provides a reliable, mathematical framework to analyze these patterns. By processing key variables over defined time periods, the calculator helps teams identify churn risks, evaluate product-market fit, and make data-driven decisions to safeguard their recurring revenue.
Deciphering the Core Metrics: CRR and Churn
Understanding customer behavior requires a clear grasp of two fundamental, interlocking metrics: Customer Retention Rate and Churn Rate. Together, these figures provide a complete picture of customer loyalty and attrition.
What is Customer Retention Rate?
Customer Retention Rate (CRR) measures the percentage of customers an organization successfully retains over a specific period, such as a month, quarter, or year. Crucially, this metric excludes any new customers acquired during that timeframe. By isolating the original cohort, CRR provides an unbiased view of customer satisfaction and product utility.
A high retention rate indicates that your product or service delivers ongoing, long-term value. This is a strong indicator of product-market fit and customer loyalty. Conversely, a low retention rate suggests a disconnect between customer expectations and the actual user experience, pointing to issues in customer onboarding, product quality, or ongoing customer support.
What is Churn Rate?
Customer Churn Rate, often referred to simply as attrition, represents the percentage of customers who end their relationship with a business during a specific timeframe. Churn is the direct mathematical mirror of retention. If a company retains 85% of its customers over a given year, it has experienced a 15% annual customer churn rate.
Total Base (100%) = Customer Retention Rate (85%) + Customer Churn Rate (15%)
Churn occurs for many reasons, which can be broadly grouped into two categories:
- Voluntary Churn: Occurs when a customer actively decides to cancel their subscription, terminate a contract, or switch to a competitor. This is usually driven by dissatisfaction, pricing concerns, or a lack of perceived value.
- Involuntary Churn: Occurs when a customer’s account is closed due to external factors, such as expired credit cards, failed payment processing, or business insolvency.
For subscription-based businesses, tracking and reducing both types of churn is critical to maintaining a healthy, growing customer base.
The Mathematical Framework of the Retention Formula
Calculating your Customer Retention Rate requires a precise formula to prevent new customer acquisitions from masking underlying customer losses.
The Standard Retention Equation
To calculate your retention rate, you need three data points from a specific tracking period:
- S = The number of active customers at the start of the period.
- N = The number of brand-new customers acquired during the period.
- E = The number of active customers at the end of the period.
These variables are calculated using the following formula:
The calculation steps are straightforward:
- Subtract the number of newly acquired customers ($N$) from the ending customer count ($E$). This isolates the surviving customers from your original user base.
- Divide this result by the number of customers you had at the start of the period ($S$). This gives you the proportion of original customers who remained loyal.
- Multiply by 100 to convert the decimal into a percentage.
Why Subtracting New Customers is Mathematically Crucial
Failing to subtract new customers from the ending count is a common mistake that can lead to misleadingly optimistic retention figures.
For example, suppose a business starts the year with 1,000 customers ($S = 1000$). Over the next twelve months, they lose 300 of those original customers, but their sales team successfully signs up 400 new accounts ($N = 400$). At the end of the year, the business has 1,100 total active customers ($E = 1100$).
If you calculate the retention rate without subtracting the new customers, the formula yields:
$$\text{Incorrect Rate} = \left(\frac{1100}{1000}\right) \times 100 = 110\%$$
This figure suggests the business has “super-retention,” when in reality it lost 30% of its starting customer base. By applying the correct formula, we see the true retention rate:
$$\text{True CRR} = \left(\frac{1100 – 400}{1000}\right) \times 100 = 70.00\%$$
This accurate calculation reveals a 30% churn rate, highlighting a clear retention issue that requires immediate attention.
The Algebraic Derivation of Churn Rate
Once you have calculated your retention rate, finding the churn rate is simple. Because retention and churn are complementary parts of a whole, you can find the churn rate using this basic subtraction:
Using our previous example, where the Customer Retention Rate was 70%, the Customer Churn Rate is:
$$\text{Churn Rate} = 100\% – 70\% = 30.00\%$$
This calculation confirms that 30% of the customers who started the period did not remain with the business by the end.
Step-by-Step Computational Scenarios and Industrial Case Studies
To show how the calculator handles different business situations, let us walk through three realistic scenarios.
Case Study 1: The SaaS Renewal Loop (Subscription-Based Model)
A Software-as-a-Service (SaaS) enterprise wants to measure its annual performance. The subscription metrics are defined as follows:
- Starting Customer Count ($S$) = 2,500 subscribers
- New Subscribers Acquired ($N$) = 450 accounts
- Ending Customer Count ($E$) = 2,600 subscribers
Let us run these numbers through our calculations:
- First, calculate the number of retained customers:$$E – N = 2600 – 450 = 2150$$
- Next, divide this by the starting customer count:$$2150 \div 2500 = 0.86$$
- Convert this fraction to a percentage:$$0.86 \times 100 = 86.00\%$$
- Finally, determine the annual churn rate:$$\text{Churn Rate} = 100\% – 86.00\% = 14.00\%$$
This SaaS business has an 86% annual retention rate, which is a healthy baseline for mid-market subscription services.
Case Study 2: High Churn vs. Aggressive Acquisition (e-Commerce Campaign)
A retail brand runs an aggressive marketing campaign. While they generate a high volume of new transactions, they struggle to turn those one-time buyers into repeat customers:
- Starting Customer Count ($S$) = 1,200 buyers
- New Customers Acquired ($N$) = 800 buyers
- Ending Customer Count ($E$) = 1,100 buyers
Let us calculate the retention rate for this campaign:
- Find the number of retained customers:$$E – N = 1100 – 800 = 300$$
- Divide by the starting count:$$300 \div 1200 = 0.25$$
- Convert to a percentage:$$0.25 \times 100 = 25.00\%$$
- Calculate the corresponding churn rate:$$\text{Churn Rate} = 100\% – 25.00\% = 75.00\%$$
Despite looking stable on the surface—ending the period with nearly as many customers as they started with—this business has a 75% churn rate. This high attrition indicates that while the acquisition team is performing well, the post-purchase experience is failing to retain customers.
Case Study 3: Stable B2B Enterprise (High-Value Contracts)
A B2B logistics firm operates on high-value, long-term contracts where keeping existing clients is the top priority:
- Starting Customer Count ($S$) = 150 partners
- New Partners Acquired ($N$) = 8 accounts
- Ending Customer Count ($E$) = 154 partners
Let us calculate their retention rate:
- Find the number of retained partners:$$E – N = 154 – 8 = 146$$
- Divide by the starting count:$$146 \div 150 = 0.9733$$
- Convert to a percentage:$$0.9733 \times 100 = 97.33\%$$
- Find the churn rate:$$\text{Churn Rate} = 100\% – 97.33\% = 2.67\%$$
A 97.33% retention rate is excellent, reflecting strong customer relationships and high barriers to entry for competitors.
Cross-Industry Retention and Churn Benchmarks
“Good” customer retention rates vary significantly by industry. Factors like business models, contract lengths, and customer acquisition costs all play a role in defining these benchmarks.
| Industry Vertical | Average Monthly Retention Rate | Average Annual Retention Rate | Primary Churn Driver |
| SaaS (Enterprise) | 98% to 99% | 75% to 90% | Implementation friction, pricing changes |
| SaaS (Self-Serve / SMB) | 92% to 95% | 35% to 55% | Budget changes, project cancellations |
| Retail & e-Commerce | 60% to 70% | 20% to 30% | Competitor pricing, transactional buying |
| Banking & Finance | 98% to 99% | 80% to 90% | Customer service, product convenience |
| Media & Entertainment | 90% to 94% | 40% to 50% | Lack of new content, fatigue |
| Telecommunications | 97% to 98% | 78% to 84% | Network reliability, promotions |
Comparative Reference: Multi-Period Retention Scenarios
The following table compares different retention and churn rates across a range of business sizes and performance levels:
| Tracking Period | Start Customers (S) | New Acquired (N) | End Customers (E) | Retained (E – N) | Retention Rate (CRR) | Churn Rate | Business Health Analysis |
| Monthly | 500 | 50 | 480 | 430 | 86.00% | 14.00% | High churn; requires product review |
| Quarterly | 10,000 | 1,200 | 10,500 | 9,300 | 93.00% | 7.00% | Stable growth with healthy retention |
| Annual | 1,500 | 300 | 1,450 | 1,150 | 76.67% | 23.33% | Typical for mid-market services |
| Annual | 80 | 12 | 90 | 78 | 97.50% | 2.50% | Excellent performance; strong loyalty |
| Custom | 12,500 | 4,500 | 13,000 | 8,500 | 68.00% | 32.00% | Growth is masked by hidden churn |
| Monthly | 200 | 45 | 180 | 135 | 67.50% | 32.50% | Attrition risk; onboarding review |
Advanced Metrics Linked to Customer Retention
While Customer Retention Rate is a powerful standalone metric, its true value is unlocked when analyzed alongside other key performance indicators.
Customer Lifetime Value
Customer Lifetime Value (LTV) estimates the total net revenue a single customer will generate for your business over the course of your entire relationship. Your retention rate is the primary driver of this value.
The customer lifespan is mathematically tied to your churn rate:
$$\text{Average Customer Lifespan} = \frac{1}{\text{Churn Rate}}$$
For example, if a business has a 10% annual churn rate, the average customer lifespan is 10 years. If the churn rate rises to 20%, the lifespan drops to 5 years.
With this lifespan figure, you can calculate your basic LTV:
$$\text{LTV} = \text{Average Revenue Per User (ARPU)} \times \text{Average Customer Lifespan}$$
This calculation highlights why retention is so valuable: reducing your churn rate in half automatically doubles your average customer lifespan, which in turn doubles your Customer Lifetime Value without requiring any additional customer acquisition spending.
Customer Acquisition Cost and the LTV:CAC Ratio
Customer Acquisition Cost (CAC) is the total marketing and sales cost required to sign up a single new customer. To evaluate the efficiency of your business model, you should track your CAC against your LTV.
$$\text{LTV:CAC Ratio} = \frac{\text{Customer Lifetime Value}}{\text{Customer Acquisition Cost}}$$
In healthy business models, particularly within the software and subscription spaces, a standard benchmark is a 3:1 ratio. This means a customer should generate three times more value over their lifespan than it cost to acquire them.
- If your ratio is 1:1 or lower, you are spending more to acquire customers than they are worth, which is unsustainable over the long term.
- If your ratio is 5:1 or higher, you may be underinvesting in marketing and sales, potentially leaving valuable growth opportunities on the table.
Cohort Analysis
A cohort analysis groups customers by their signup date (for example, monthly cohorts) and tracks how their retention rate changes over time. Rather than looking at a single, company-wide retention average, cohort analysis lets you see how specific groups of customers behave over their lifecycles.
Analyzing cohorts helps you identify critical trends, such as:
- The Onboarding Drop-off: Identifying if a large percentage of users churn within their first 30 days, which often points to onboarding difficulties or a lack of clear initial value.
- Product Update Impacts: Tracking if cohorts acquired after a major product update retain better than older cohorts, helping you measure the real-world impact of your development efforts.
- Seasonal Behaviors: Spotting if customers signed up during holiday promotions churn faster than organic, non-promotional signups.
Algorithmic Mechanics of the Pro Retention Calculator
The Pro Retention Rate Calculator uses a structured JavaScript routine to run calculations safely and prevent incorrect data entries.
Input Validations and Integrity Safeguards
To ensure accurate results, the script runs several validation checks on your inputs:
- Starting Customers ($S$): Must be a positive integer greater than zero. If $S = 0$, the division returns an error, as you cannot calculate a retention rate without an active starting customer base.
- Retained Customers ($E – N$): This value cannot be negative. If the ending customer count ($E$) is lower than the number of newly acquired customers ($N$), the program displays an error. This scenario is mathematically impossible because a business cannot acquire more new customers during a period than the total number of customers they ended with.
- Starting Bounds ($E – N \le S$): The number of retained customers cannot exceed the starting customer count. You cannot retain more customers from your starting cohort than you originally had.
Donut Chart Visualization Logic
To make the data easier to interpret, the calculator includes an interactive SVG donut chart. The progress ring is animated using the CSS transition properties of SVG stroke-dasharray and stroke-dashoffset:
$$\text{Circumference} = 2 \times \pi \times r = 2 \times \pi \times 45 \approx 283$$
$$\text{stroke-dashoffset} = 283 – \left(283 \times \frac{\text{Retention Rate}}{100}\right)$$
This visual indicator changes color dynamically based on your results. If the retention rate falls below 50%, the indicator turns red to highlight a high-churn situation. If the rate is 50% or higher, the indicator displays in a standard professional blue, providing a clear visual cue of your retention health.
Strategic Playbook to Optimize Customer Retention
Improving your customer retention rate requires a deliberate, structured approach across your entire customer lifecycle.
Onboarding (Clear Value) → Product Value (Utility) → Customer Support (Assistance) → Success Loops (Growth)
1. Streamline Your Onboarding Process
Many customers churn early because they struggle to understand how to use a product or fail to see its value quickly. To improve your early-stage retention:
- Minimize friction during signup and setup.
- Guide users to their “Aha” moment—the point where they first experience the core value of your product—as quickly as possible.
- Use interactive, step-by-step walk-throughs rather than long text manuals.
2. Monitor Key Usage Indicators
Customers rarely churn without warning. By tracking product usage data, you can spot early signs of disengagement:
- Watch for drops in login frequency, core feature usage, or account setting activity.
- Set up automated triggers to alert your customer success team when an account’s activity levels drop below established thresholds.
- Reach out proactively to users who show signs of slipping away, offering targeted help or resources before they decide to cancel.
3. Establish Feedback Loops
Understanding why customers leave is key to keeping future ones.
- Use automated, single-question surveys like Net Promoter Score (NPS) or Customer Satisfaction (CSAT) prompts at key milestones in the customer journey.
- Conduct structured exit interviews when customers cancel to gather candid feedback on where your product or service fell short.
- Feed these insights directly back to your product development and customer service teams to address root causes of churn.
Scientific and Business Reference
For an authoritative, academic foundation on customer retention and its impact on corporate economics, please refer to the following peer-reviewed research:
Reichheld, Frederick F., and W. Earl Sasser, Jr. “Zero Defections: Quality Comes to Services.” Harvard Business Review, vol. 68, no. 5, 1990, pp. 105-111.
This foundational study demonstrates the direct, compounding correlation between customer retention rates and long-term business profitability.
Frequently Asked Questions
Can Customer Retention Rate ever exceed 100%?
No. By definition, Customer Retention Rate isolates the original cohort by subtracting new customers ($E – N$). Because you cannot retain more customers than you started with, your CRR is capped at 100%.
If you are looking for a metric that can exceed 100%, you should track Net Revenue Retention (NRR). NRR includes expansion revenue from upgrades, cross-sales, and add-ons, allowing it to go above 100% when expansion revenue from existing customers outpaces churn.
How often should our business calculate retention?
The ideal calculation frequency depends on your business model:
- High-Transaction / e-Commerce: Should track monthly and quarterly to spot seasonal trends and react quickly to changes.
- Enterprise B2B / Long-Term Contracts: Typically tracks annually or semi-annually, aligning with major renewal cycles.
What is the difference between customer retention and revenue retention?
Customer retention tracks the physical number of customer accounts you keep, treating every customer equally. Revenue retention tracks the financial value of those accounts.
A business can keep 95% of its customers but still lose 30% of its revenue if its largest customers cancel their contracts. Tracking both metrics gives you a complete view of your business health.
How do upgrades and downgrades affect basic customer retention?
Basic customer retention only tracks whether an account remains active or inactive, meaning upgrades and downgrades do not affect your CRR. To measure the financial impact of plan changes, you should track Net Revenue Retention (NRR) and Gross Revenue Retention (GRR).
Why is a low customer acquisition cost sometimes risky?
While a low CAC is generally desirable, it can sometimes indicate that a business is focusing on low-intent, transactional buyers who churn quickly. Often, spending more to acquire higher-quality, long-term customers leads to better overall business health and higher total profits.