Run accounting ratio calculator
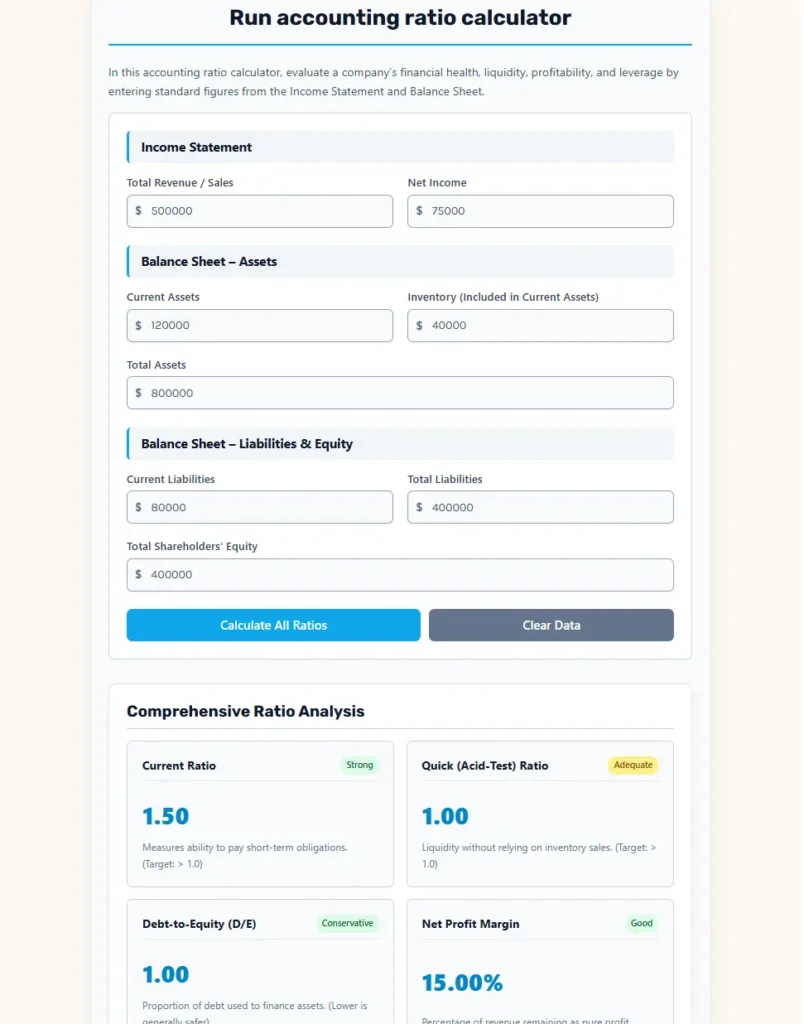
In this accounting ratio calculator, evaluate a company’s financial health, liquidity, profitability, and leverage by entering standard figures from the Income Statement and Balance Sheet.
Comprehensive Ratio Analysis
Formulas & Definitions
Liquidity Ratios
Current Ratio: Evaluates if a company has enough short-term assets to cover short-term debts.
Quick Ratio: A stricter liquidity test that strips out inventory, which isn’t always easily converted to cash.
Solvency Ratios
Debt-to-Equity: Indicates how much debt a company is using to finance its operations relative to the capital invested by shareholders.
Profitability Ratios
Net Profit Margin: The classic “bottom line” measurement.
ROA & ROE: These measure how efficiently management is using the company’s resources and shareholder money to create profits.
ROE = ( Net Income ÷ Total Equity ) × 100
The Analytical Engine of Finance: Mastering Accounting Ratio Analysis
Raw financial data holds limited intrinsic value when isolated. A company reporting a net profit of ten million dollars may appear exceptionally prosperous, yet if this profit was generated using one billion dollars of invested capital, the return is a meager one percent. To assess the true operational health, structural stability, and capital efficiency of any business entity, analysts must employ the mathematical framework of accounting ratio analysis.
Accounting ratios act as diagnostic filters that standardize complex, multi-layered financial statements. They allow credit analysts, corporate executives, and equity investors to compare enterprises across different sizes, industries, and historical epochs. This comprehensive guide details the mechanics, formulas, and structural boundaries of standard financial ratios, transitioning from introductory concepts to advanced strategic frameworks.
The Fundamental Taxonomy of Financial Ratios
Financial ratios are broadly categorized based on the specific aspect of corporate performance they are designed to evaluate. A balanced financial analysis must examine all categories simultaneously to prevent misleading conclusions.
➜ Liquidity Ratios: Measure an entity’s capacity to meet its short-term financial obligations as they fall due, focusing on the relationship between current assets and current liabilities.
➜ Solvency Ratios: Assess long-term capital structure, leverage, and the ability to sustain permanent interest and debt-repayment burdens over multiple business cycles.
➜ Profitability Ratios: Evaluate the corporate engine’s capacity to generate earnings relative to sales revenues, operating costs, total balance sheet assets, and shareholders’ equity.
➜ Efficiency Ratios: Quantify the velocity at which an enterprise deploys its working capital, inventories, receivables, and fixed assets to generate productive revenue.
Section 1: Liquidity Ratios – Sizing up Short-Term Solvency
Liquidity is the bedrock of corporate survival. A highly profitable company can easily descend into bankruptcy if its cash inflows are poorly timed relative to its near-term cash liabilities. The following ratios evaluate the safety margin built into an entity’s working capital.
1. The Current Ratio
The Current Ratio is the standard gauge of short-term financial health, comparing total liquid or near-liquid resources against liabilities maturing within twelve months.$$CR = \frac{CA}{CL}$$
Variable Definitions:
➜ $CR$: The calculated Current Ratio.
➜ $CA$: Total Current Assets, including cash, marketable securities, accounts receivable, and inventory.
➜ $CL$: Total Current Liabilities, representing obligations due within one fiscal year.
2. The Quick Ratio (Acid Test)
Because inventory can take months to liquidate and may incur steep write-downs during forced sales, the Quick Ratio strips out inventories and pre-paid expenses to focus purely on highly liquid assets.$$QR = \frac{CA – I}{CL}$$
Variable Definitions:
➜ $QR$: The calculated Quick Ratio.
➜ $CA$: Total Current Assets.
➜ $I$: The carrying value of Inventory on the balance sheet.
➜ $CL$: Total Current Liabilities.
3. The Cash Ratio
The most conservative liquidity metric, the Cash Ratio evaluates an entity’s ability to cover its near-term obligations using only cash reserves and cash equivalents.$$CashR = \frac{C + CE}{CL}$$
Variable Definitions:
➜ $CashR$: The calculated Cash Ratio.
➜ $C$: Cash holdings.
➜ $CE$: Cash Equivalents, representing highly liquid, short-term treasury bills or money market funds.
➜ $CL$: Total Current Liabilities.
Section 2: Solvency Ratios – Long-Term Leverage and Risk
While liquidity focuses on the immediate twelve-month horizon, solvency ratios evaluate how a firm finances its permanent assets. Capital structure is a delicate balance: debt can amplify equity returns during periods of growth, but it introduces fixed obligations that can crush an underperforming business during economic contractions.
1. The Debt-to-Equity Ratio
This ratio compares the proportion of capital provided by creditors to the capital provided by shareholders, indicating the level of leverage employed by management.$$DE = \frac{TL}{SE}$$
Variable Definitions:
➜ $DE$: The Debt-to-Equity Ratio.
➜ $TL$: Total Liabilities, including both current and non-current debt.
➜ $SE$: Shareholders’ Equity, representing common stock, paid-in capital, and retained earnings.
2. The Debt Ratio (Debt-to-Assets)
The Debt Ratio measures the percentage of a company’s assets financed through borrowing, reflecting its structural vulnerability to credit market shocks.$$DA = \frac{TL}{TA}$$
Variable Definitions:
➜ $DA$: The Debt-to-Assets Ratio.
➜ $TL$: Total Liabilities.
➜ $TA$: Total Assets, representing the cumulative balance sheet size.
Section 3: Profitability Ratios – Measuring the Return on Capital
Profitability ratios evaluate the bottom-line performance of a business. They reflect pricing power, cost management, and the overall productivity of the capital invested in the enterprise.
1. Gross Profit Margin
This metric reflects the direct efficiency of production or procurement before administrative overhead, marketing costs, and financing expenses are accounted for.$$GPM = \frac{S – COGS}{S}$$
Variable Definitions:
➜ $GPM$: The Gross Profit Margin, expressed as a decimal or percentage.
➜ $S$: Net Sales or Revenue.
➜ $COGS$: Cost of Goods Sold, representing the direct costs of producing goods or services.
2. Operating Profit Margin (EBIT Margin)
The Operating Profit Margin measures the percentage of revenue remaining after paying for both direct production costs and indirect operating overhead, reflecting pure operational efficiency.$$OM = \frac{EBIT}{S}$$
Variable Definitions:
➜ $OM$: The Operating Profit Margin.
➜ $EBIT$: Earnings Before Interest and Taxes, representing operating income.
➜ $S$: Net Sales or Revenue.
3. Net Profit Margin
The ultimate bottom-line metric, the Net Profit Margin reveals the percentage of revenue that successfully translates into net income for shareholders after all expenses, interest, and taxes are paid.$$NPM = \frac{NI}{S}$$
Variable Definitions:
➜ $NPM$: The Net Profit Margin.
➜ $NI$: Net Income, representing corporate profit after taxes.
➜ $S$: Net Sales or Revenue.
4. Return on Assets (ROA)
ROA evaluates how effectively a firm’s management deploys its entire asset base to generate earnings, regardless of how those assets are financed.$$ROA = \frac{NI}{TA}$$
Variable Definitions:
➜ $ROA$: The Return on Assets.
➜ $NI$: Net Income.
➜ $TA$: Total Assets.
5. Return on Equity (ROE)
The most closely watched metric by equity investors, ROE measures the rate of return earned on the capital provided directly by the company’s owners.$$ROE = \frac{NI}{SE}$$
Variable Definitions:
➜ $ROE$: The Return on Equity.
➜ $NI$: Net Income.
➜ $SE$: Shareholders’ Equity.
Section 4: Efficiency and Activity Ratios – Operational Velocity
Efficiency ratios evaluate how quickly a company converts its operating assets into cash or sales. High efficiency means capital is tied up for less time, reducing the need for costly external financing.
1. Asset Turnover Ratio
This ratio measures how productively a company uses its entire asset base to generate sales revenue, reflecting capital intensity.$$ATR = \frac{S}{TA}$$
Variable Definitions:
➜ $ATR$: The Asset Turnover Ratio.
➜ $S$: Net Sales or Revenue.
➜ $TA$: Total Assets.
2. Inventory Turnover Ratio
The Inventory Turnover Ratio indicates how many times a company’s average inventory is sold and replaced over a year. A low turnover rate indicates overstocking, obsolescence, or weak product demand.$$ITR = \frac{COGS}{I}$$
Variable Definitions:
➜ $ITR$: The Inventory Turnover Ratio.
➜ $COGS$: Cost of Goods Sold.
➜ $I$: The carrying value of Inventory.
3. Days Sales Outstanding (DSO)
DSO, also known as the Average Collection Period, measures the average number of days it takes for a company to collect cash from customers after a credit sale is completed.$$DSO = \left( \frac{AR}{S} \right) \times 365$$
Variable Definitions:
➜ $DSO$: Days Sales Outstanding.
➜ $AR$: Accounts Receivable on the balance sheet.
➜ $S$: Net Sales or Revenue.
➜ $365$: The standard constant representing days in a fiscal year.
4. Days Payable Outstanding (DPO)
DPO measures the average number of days a company takes to pay its suppliers. While delaying payments preserves cash, excessively high DPO can damage supplier relationships and cost-saving terms.$$DPO = \left( \frac{AP}{COGS} \right) \times 365$$
Variable Definitions:
➜ $DPO$: Days Payable Outstanding.
➜ $AP$: Accounts Payable on the balance sheet.
➜ $COGS$: Cost of Goods Sold.
➜ $365$: Days in a fiscal year.
The Cash Conversion Cycle: Integrating Efficiency Metrics
By combining inventory turnover, accounts receivable collection times, and supplier payment terms, managers can calculate the Cash Conversion Cycle (CCC). This integrated metric tracks the lifespan of a dollar: from the moment it is spent on raw materials to the moment it is recovered from customer sales.$$CCC = DIO + DSO – DPO$$
Variable Definitions:
➜ $CCC$: The Cash Conversion Cycle in days.
➜ $DIO$: Days Inventory Outstanding, calculated as $365 \div ITR$.
➜ $DSO$: Days Sales Outstanding.
➜ $DPO$: Days Payable Outstanding.
A shorter Cash Conversion Cycle represents a highly efficient business that generates cash quickly, reducing its reliance on credit lines and external capital.
Comprehensive Case Study: Aegis Manufacturing Corporation
To demonstrate these formulas in a practical context, we can evaluate a year-end financial statement for a fictional firm: Aegis Manufacturing Corporation.
1. Selected Balance Sheet Parameters
- Cash & Equivalents ($C + CE$): $\$45,000$
- Accounts Receivable ($AR$): $\$55,000$
- Inventory ($I$): $\$75,000$
- Total Current Assets ($CA$): $\$195,000$
- Total Assets ($TA$): $\$480,000$
- Accounts Payable ($AP$): $\$35,000$
- Total Current Liabilities ($CL$): $\$90,000$
- Total Liabilities ($TL$): $\$180,000$
- Shareholders’ Equity ($SE$): $\$300,000$
2. Selected Income Statement Parameters
- Net Sales ($S$): $\$650,000$
- Cost of Goods Sold ($COGS$): $\$380,000$
- Operating Income ($EBIT$): $\$110,000$
- Net Income ($NI$): $\$75,000$
Step-by-Step Diagnostic Calculation
Using the Aegis Manufacturing data, we can calculate each of the primary metrics step-by-step.
➜ Liquidity Calculations
- Current Ratio:
$$CR = \frac{195,000}{90,000} \approx 2.17\text{x}$$The current assets cover current liabilities more than twice over, indicating solid short-term positioning. - Quick Ratio:
$$QR = \frac{195,000 – 75,000}{90,000} \approx 1.33\text{x}$$Even when subtracting inventory, Aegis can cover its short-term debts with immediate cash and receivables.
➜ Solvency Calculations
- Debt-to-Equity:
$$DE = \frac{180,000}{300,000} = 0.60\text{x}$$For every dollar of equity, Aegis carries sixty cents of debt, which represents a conservative capital structure. - Debt Ratio:
$$DA = \frac{180,000}{480,000} = 37.5\%$$Aegis finances $37.5\%$ of its assets through liabilities, with the remaining $62.5\%$ financed by equity.
➜ Profitability Calculations
- Gross Profit Margin:
$$GPM = \frac{650,000 – 380,000}{650,000} \approx 41.5\%$$Aegis retains $41.5\%$ of its revenues after covering direct manufacturing and production costs. - Operating Profit Margin:
$$OM = \frac{110,000}{650,000} \approx 16.9\%$$Operating income represents $16.9\%$ of total revenue, reflecting efficient overhead management. - Net Profit Margin:
$$NPM = \frac{75,000}{650,000} \approx 11.5\%$$Aegis converts $11.5\%$ of its sales into net income for shareholders. - Return on Equity:
$$ROE = \frac{75,000}{300,000} = 25.0\%$$Aegis generates a strong twenty-five percent return on the capital invested by its owners.
➜ Efficiency Calculations
- Inventory Turnover:
$$ITR = \frac{380,000}{75,000} \approx 5.07\text{x}$$Aegis sells and replaces its inventory roughly five times per year. - Days Sales Outstanding:
$$DSO = \left( \frac{55,000}{650,000} \right) \times 365 \approx 30.9\text{ days}$$Aegis collects its receivables in an average of thirty-one days, reflecting disciplined credit terms.
The DuPont System of Analysis: Deconstructing Return on Equity
To understand what drives a company’s profitability, financial managers rely on the DuPont System. This model breaks down Return on Equity into three distinct components, highlighting whether a high ROE is driven by operational efficiency, asset utilization, or financial leverage.
$$ROE = NPM \times AT \times EM$$
Where:
$EM$: Equity Multiplier (Financial Leverage)
$ROE$: Return on Equity
$NPM$: Net Profit Margin (Operational Efficiency)
$AT$: Asset Turnover (Asset Utilization)
Applying the DuPont Model to Aegis Manufacturing
Using the calculations from our case study, we can deconstruct the company’s $25\%$ ROE:$$\text{ROE} = 0.11538 \times 1.35417 \times 1.600 \approx 25.0\%$$
This analysis reveals that Aegis’s $25\%$ ROE is driven by a balanced combination of solid operational margins ($11.5\%$), efficient asset deployment ($1.35\text{x}$ turnover), and moderate financial leverage ($1.60\text{x}$ multiplier). If the company were to double its leverage to increase ROE, the DuPont model would flag this change as an increase in financial risk rather than an improvement in operational efficiency.
Structural Differences: Industry Benchmarks Compared
A ratio that indicates excellent performance in one sector can signal operational failure in another. Every industry operates under unique structural constraints.
| Ratio Metric | SaaS / Technology | Grocery / Supermarkets | Electric Utilities |
| Gross Profit Margin | $80\% – 90\%$ | $15\% – 25\%$ | $40\% – 60\%$ |
| Debt-to-Equity Ratio | $0.1 – 0.5\text{x}$ | $1.0 – 2.0\text{x}$ | $2.5 – 4.0\text{x}$ |
| Inventory Turnover | Minimal / Not Applicable | $15 – 30\text{x}$ | Not Applicable |
| Asset Turnover | $0.5 – 0.8\text{x}$ | $2.0 – 3.5\text{x}$ | $0.3 – 0.5\text{x}$ |
- SaaS/Technology Companies: These firms boast exceptionally high gross profit margins because their software has low replication costs. However, they typically show lower asset turnover rates due to massive cash reserves on their balance sheets.
- Grocery Retailers: Operate on thin profit margins but offset this with rapid inventory turnover and asset utilization. They make their profit by selling high volumes of products quickly.
- Electric Utilities: Require massive capital investments in infrastructure, resulting in low asset turnover and high debt-to-equity ratios. However, their stable, regulated cash flows allow them to safely carry this high debt burden.
Strategic Limitations and Pitfalls of Ratio Analysis
While accounting ratios are powerful diagnostic tools, they are not infallible. Analysts must recognize the limitations of these metrics to avoid flawed conclusions.
➜ Creative Accounting and Window Dressing: Management can temporarily alter balance sheet metrics near the end of a fiscal quarter. For example, delaying supplier payments or accelerating receivable collections can temporarily boost cash balances and improve the Current Ratio, masking underlying cash flow issues.
➜ Historical Nature of Data: Financial statements are backward-looking documents. A company may report stellar historical profitability ratios while its market share is actively being eroded by technological disruption.
➜ Inflationary Distortions: Historical cost accounting does not adjust asset values for inflation. If a firm purchased property decades ago, its recorded asset values will be artificially low, which can distort the Return on Assets calculation.
➜ Inconsistent Accounting Policies: Comparing two companies in the same sector can be difficult if one uses FIFO (First-In, First-Out) inventory valuation and the other uses LIFO (Last-In, First-Out). These accounting choices significantly impact both the reported inventory values and the Cost of Goods Sold.
Academic Reference and Regulatory Citations
The mathematical models and disclosure frameworks used in financial accounting are governed by international standards organizations.
Relevance: FASB establishes the Generally Accepted Accounting Principles (GAAP) used in the United States, while the International Accounting Standards Board (IASB) manages the International Financial Reporting Standards (IFRS) globally. These regulatory bodies define the formatting, asset classifications, and revenue recognition guidelines that ensure balance sheets and income statements are standardized. This standardization is what allows this accounting ratio calculator to accurately compute financial ratios across different enterprises.
Strategic Financial Checklist for Executives
Before using ratio calculations to make major corporate decisions, executives should run through this checklist:
✓ Have you compared your company’s ratios against the median benchmarks of your specific peer group?
✓ Have you verified that your inventory and revenue recognition policies are consistent with those of your competitors?
✓ Are you monitoring both aggregate and per-card/individual credit lines to prevent localized bottlenecks?
✓ Have you deconstructed your ROE using the DuPont framework to ensure your returns are driven by operational efficiency rather than excessive leverage?
✓ Are you tracking ratios over multiple quarters to identify long-term trends rather than relying on a single, isolated snapshot?
By applying these mathematical standards and accounting ratio calculator, financial managers can look past raw numbers and understand the true mechanics of corporate performance. Precision in accounting ratio analysis is the foundation of disciplined risk management and strategic business growth.