best Profit Calculator
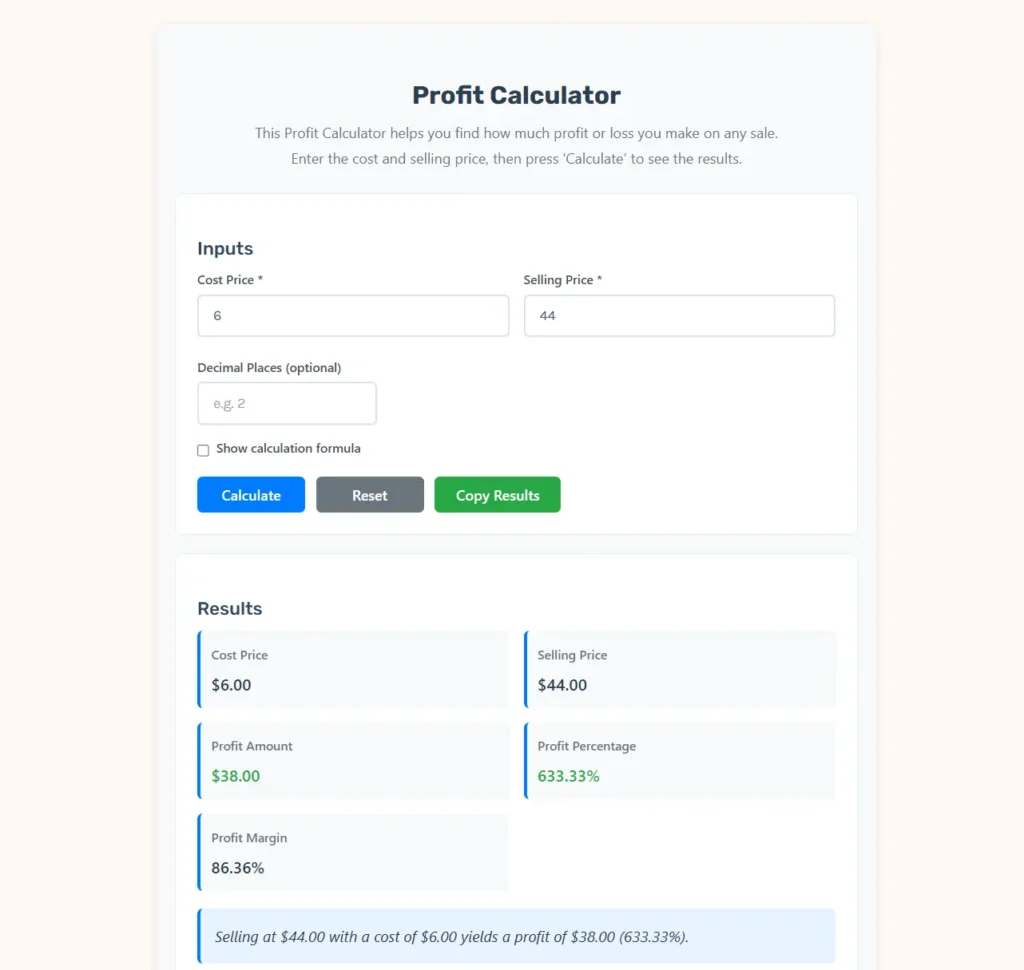
This Profit Calculator helps you find how much profit or loss you make on any sale.
Enter the cost and selling price, then press ‘Calculate’ to see the results.
Inputs
Formula
Profit = Selling Price − Cost Price
Profit Percentage = (Profit ÷ Cost Price) × 100
Profit Margin = (Profit ÷ Selling Price) × 100
Example
Cost Price = $100, Selling Price = $120
→ Profit = $120 − $100 = $20
→ Profit% = (20 ÷ 100) × 100 = 20%
→ Profit Margin = (20 ÷ 120) × 100 = 16.67%
Explanation
In business, profit represents the difference between what you sell an item for and what it cost you. Profit percentage helps evaluate performance relative to your investment, while profit margin shows how much of each sale dollar is actual profit. Understanding both metrics helps you make better pricing and business decisions.
Financial Economics of Profit: A Comprehensive Guide to Margins, Markups, and Unit Economics
In the management of modern commercial enterprises, maintaining a rigorous understanding of unit economics serves as the foundation for long-term survival. While gross transaction volumes and market share indicate scale, they do not guarantee financial stability. To evaluate the true viability of an enterprise, business owners, corporate finance officers, and investment analysts rely on profit metrics.
Analyzing the relationship between what it costs to produce a product and what that product sells for is the primary step in evaluating financial health. This process allows management to establish logical pricing strategies, control direct expenditures, and make informed choices about resource allocation. This guide explores the concepts, mathematical formulations, industry benchmarks, and strategic pricing models of corporate profit analysis.
The Fundamental Concepts of Profitability in Business Systems
Before executing calculations, it is critical to separate absolute financial metrics from relative efficiency ratios. Absolute profit measures the exact currency amount extracted from a transaction, whereas relative profit metrics show how efficiently that extraction was achieved.
These financial metrics are generally categorized as follows:
$\checkmark$ Gross Profit: The surplus cash remaining after subtracting the direct costs of goods sold from gross revenues.
$\checkmark$ Profit Percentage (Markup): The relative relationship showing how much the selling price exceeds the original cost basis.
$\checkmark$ Profit Margin: The ratio showing what portion of each dollar of revenue is actual take-home profit.
By evaluating both absolute and relative profit metrics, management teams can make strategic adjustments to their business models:
- Assess Viability: Absolute profit demonstrates whether a business can generate enough cash to cover its fixed costs, such as rent, administrative salaries, and equipment leases.
- Determine Scaling Potential: Relative profit ratios show whether a business can scale efficiently. A product with a high profit margin can support aggressive marketing campaigns, while a low-margin product requires high sales volumes to survive.
- Identify Inefficiencies: Shifting margins over time alert managers to rising material costs, supply chain bottlenecks, or descending pricing power.
Margin vs. Markup: The Strategic and Mathematical Divide
One of the most common operational errors in business management is confusing markup with profit margin. While both metrics evaluate the relationship between direct costs and final selling prices, they use different denominators. This mathematical difference leads to completely different percentage values.
1. Profit Margin Deconstructed
Profit margin measures the relationship between profit and selling price, showing what percentage of the final retail price is retained as profit. The selling price serves as the denominator in this calculation.
2. Markup Percentage Deconstructed
Markup measures the relationship between profit and cost, indicating the percentage added to the wholesale or direct production cost to determine the final retail price. The cost price serves as the denominator in this calculation.
The table below illustrates this relationship, showing how specific markup percentages translate to corresponding profit margins.
| Unit Cost Price ($) | Target Selling Price ($) | Calculated Markup Percentage | Resulting Profit Margin |
| $\$10.00$ | $\$12.50$ | $25.00\%$ | $20.00\%$ |
| $\$10.00$ | $\$15.00$ | $50.00\%$ | $33.33\%$ |
| $\$10.00$ | $\$20.00$ | $100.00\%$ | $50.00\%$ |
| $\$10.00$ | $\$30.00$ | $200.00\%$ | $66.67\%$ |
| $\$10.00$ | $\$40.00$ | $300.00\%$ | $75.00\%$ |
| $\$10.00$ | $\$50.00$ | $400.00\%$ | $80.00\%$ |
The Margin-Markup Conversion Equations
To convert markup directly to profit margin or vice-versa without calculating absolute profits, analysts use simplified mathematical formulas.
To find the profit margin ($\text{M}$) from a known markup percentage ($\text{U}$):$$\text{M} = \frac{\text{U}}{1 + \text{U}}$$
Where:
- $\rightarrow$ $\text{M}$ represents the profit margin expressed as a decimal value.
- $\rightarrow$ $\text{U}$ represents the markup percentage expressed as a decimal value.
To find the markup percentage ($\text{U}$) from a known profit margin ($\text{M}$):$$\text{U} = \frac{\text{M}}{1 – \text{M}}$$
Where:
- $\rightarrow$ $\text{U}$ represents the markup percentage expressed as a decimal value.
- $\rightarrow$ $\text{M}$ represents the profit margin expressed as a decimal value.
The Mathematical Architecture of Profit Calculations
To ensure perfect legibility on mobile devices, tablets, and narrow screen containers, all formulas are broken down into single-step, vertically stacked equations.
Absolute Profit Calculation
Absolute profit represents the exact currency amount remaining after subtracting the cost price from the final selling price.$$\text{P} = \text{SP} – \text{CP}$$
Where:
- $\rightarrow$ $\text{P}$ represents the absolute Profit (or Loss if the value is negative).
- $\rightarrow$ $\text{SP}$ represents the unit Selling Price.
- $\rightarrow$ $\text{CP}$ represents the unit Cost Price.
Profit Percentage (Markup on Cost)
Profit percentage measures the return on investment relative to your cost basis, indicating how much you have marked up your product.$$\text{PP} = \frac{\text{P}}{\text{CP}} \times 100$$
Where:
- $\rightarrow$ $\text{PP}$ represents the Profit Percentage (Markup on Cost).
- $\rightarrow$ $\text{P}$ represents the absolute Profit.
- $\rightarrow$ $\text{CP}$ represents the unit Cost Price.
Profit Margin Percentage
Profit margin measures the percentage of the selling price that is retained as profit, showing how much of each dollar of sales revenue represents actual profit.$$\text{PM} = \frac{\text{P}}{\text{SP}} \times 100$$
Where:
- $\rightarrow$ $\text{PM}$ represents the Profit Margin percentage.
- $\rightarrow$ $\text{P}$ represents the absolute Profit.
- $\rightarrow$ $\text{SP}$ represents the unit Selling Price.
Industry Benchmarks and Sector Analysis
Different industries operate under distinct economic structures, meaning target profit margins vary widely across sectors. A high-volume business like grocery retail can be highly successful with low margins, whereas a software company requires much higher margins to cover its development costs.
The table below outlines typical ranges for gross margins, markup percentages, and net margins across key industries.
| Industry Classification | Average Cost Structure | Typical Markup Range | Average Net Margin | Key Profit Drivers |
| Enterprise Software (SaaS) | Low direct cost | $300\% – 900\%$ | $15\% – 25\%$ | Cloud infrastructure, R&D, sales commissions |
| Restaurant & Food Service | High labor and material | $150\% – 233\%$ | $3\% – 8\%$ | Raw food spoilage, kitchen labor, utilities |
| Retail Grocery Chains | High material cost | $17\% – 33\%$ | $1\% – 3\%$ | Shipping and logistics, inventory turnover, spoilage |
| Heavy Manufacturing | High equipment and labor | $33\% – 67\%$ | $6\% – 12\%$ | Raw materials, industrial energy, factory labor |
| Consulting & Services | High professional labor | $100\% – 233\%$ | $10\% – 20\%$ | Professional labor, software tools, marketing |
Real-World Operational Scenarios
To see how these formulas apply in practice, we can analyze two detailed operational scenarios: a standard retail item and a premium boutique service.
Case Study A: Standard Retail E-Commerce Product
An e-commerce business sells customized smart watches online.
- $\rightarrow$ Cost Price ($\text{CP}$) = $\$45.00$
- $\rightarrow$ Selling Price ($\text{SP}$) = $\$125.00$
Step 1: Calculate the Absolute Profit$$\text{P} = \text{SP} – \text{CP}$$$$\text{P} = 125.00 – 45.00$$$$\text{P} = 80.00$$
Where:
- $\rightarrow$ $\text{P}$ represents the absolute Profit.
Step 2: Calculate the Profit Percentage (Markup on Cost)$$\text{PP} = \frac{\text{P}}{\text{CP}} \times 100$$$$\text{PP} = \frac{80.00}{45.00} \times 100$$$$\text{PP} \approx 177.78\%$$
Where:
- $\rightarrow$ $\text{PP}$ represents the Profit Percentage.
Step 3: Calculate the Profit Margin$$\text{PM} = \frac{\text{P}}{\text{SP}} \times 100$$$$\text{PM} = \frac{80.00}{125.00} \times 100$$$$\text{PM} = 64.00\%$$
Where:
- $\rightarrow$ $\text{PM}$ represents the Profit Margin.
This e-commerce business operates on a healthy gross profit margin of $64.00\%$, with a markup of $177.78\%$, which provides ample room to absorb digital advertising costs and shipping fees.
Case Study B: Low-Margin, High-Volume Clearance Sale
A retail outlet liquidates slow-moving inventory to free up warehouse space.
- $\rightarrow$ Cost Price ($\text{CP}$) = $\$85.00$
- $\rightarrow$ Selling Price ($\text{SP}$) = $\$65.00$
Step 1: Calculate the Absolute Profit (or Loss)$$\text{P} = \text{SP} – \text{CP}$$$$\text{P} = 65.00 – 85.00$$$$\text{P} = -20.00$$
Where:
- $\rightarrow$ $\text{P}$ represents the absolute Loss (indicated by the negative value).
Step 2: Calculate the Loss Percentage$$\text{PP} = \frac{\text{P}}{\text{CP}} \times 100$$$$\text{PP} = \frac{-20.00}{85.00} \times 100$$$$\text{PP} \approx -23.53\%$$
Where:
- $\rightarrow$ $\text{PP}$ represents the Loss Percentage.
Step 3: Calculate the Loss Margin$$\text{PM} = \frac{\text{P}}{\text{SP}} \times 100$$$$\text{PM} = \frac{-20.00}{65.00} \times 100$$$$\text{PM} \approx -30.77\%$$
Where:
- $\rightarrow$ $\text{PM}$ represents the Loss Margin.
Strategic Takeaway: Selling an item below cost results in a negative profit margin of $-30.77\%$. While selling at a loss is generally undesirable, liquidating stale stock at a loss of $-\$20.00$ per unit is often a strategic choice to recover partial capital and avoid ongoing warehouse storage fees.
Strategic Tactics for Profit Margin Optimization
To systematically improve profit margins, corporate managers must address both operational efficiencies and pricing strategies:
- Optimize Cost of Goods Sold: Review supplier contracts, purchase raw materials in bulk, or automate assembly steps to lower direct manufacturing costs and expand your Gross Profit Margin.
- Control Operating Expenses: Automate repetitive administrative tasks and scale back non-essential services to ensure sales growth outpaces overhead expenses, boosting your Operating Margin.
- Leverage Value-Based Pricing: Rather than using simple cost-plus pricing, set your selling price based on the perceived value of your product to the customer. This can increase margins without changing production costs.
- Manage Your Product Mix: Shift your sales focus toward your highest-margin products. By prioritizing marketing spend on high-margin items and phasing out low-margin products, you can improve your overall average profitability.
Academic Foundations and Industry References
This guide is built on the core managerial accounting and financial principles detailed in:
- Weygandt, J. J., Kimmel, P. D., & Kieso, D. E. (2018). Managerial Accounting: Tools for Business Decision Making. Wiley.
- For official regulatory guidance on corporate financial reporting and standard accounting disclosures, refer to the Financial Accounting Standards Board (FASB) database.