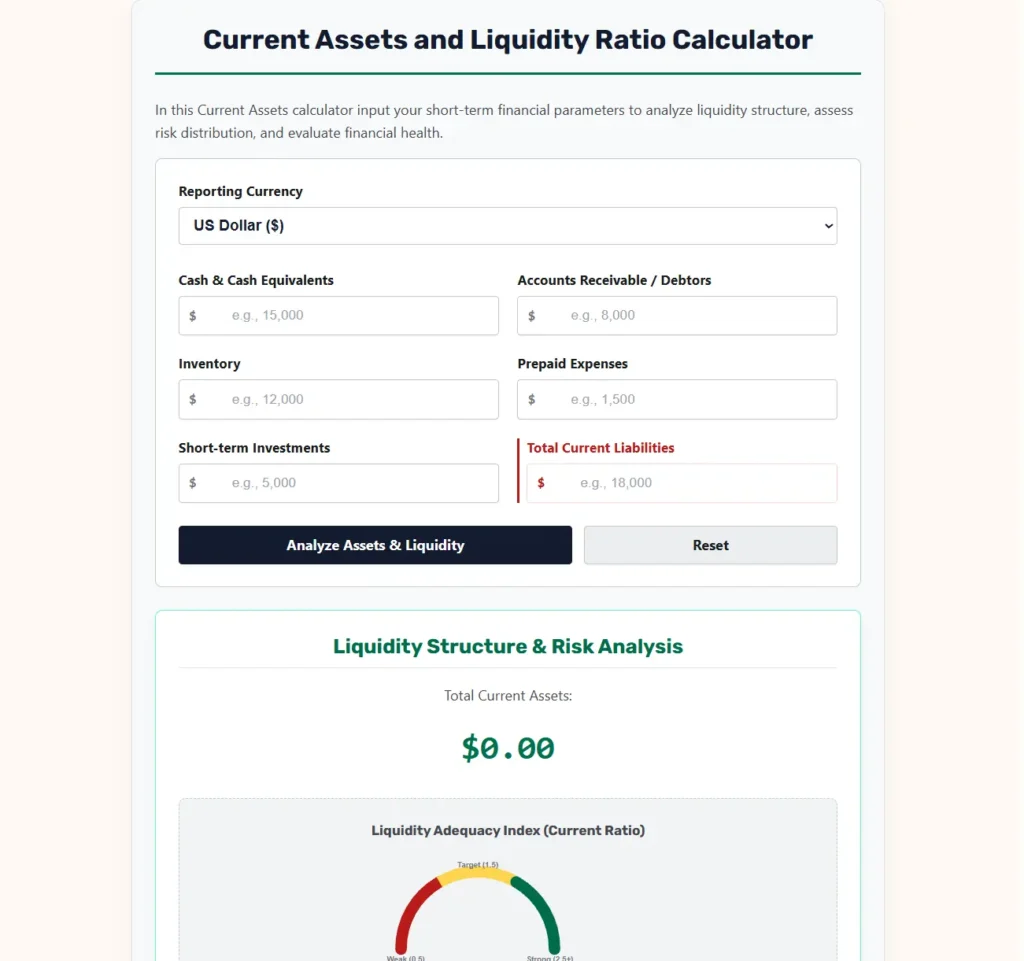
Current Assets and Liquidity Ratio Calculator
In this Current Assets calculator input your short-term financial parameters to analyze liquidity structure, assess risk distribution, and evaluate financial health.
Liquidity Structure & Risk Analysis
Total Current Assets:
$0.00Liquidity Adequacy Index (Current Ratio)
Current Assets Composition:
Guide to Understanding Asset Liquidity
What are Current Assets?
Current assets are short-term economic resources owned by a business that are expected to be converted into cash, sold, or consumed within one year or one operating cycle, whichever is longer. Common components include cash, short-term marketable securities, accounts receivable, inventory, and prepaid expenses.
Standard Liquidity Ratios & Formulas
Liquidity risk is measured by comparing short-term assets against liabilities. The relationship is represented by three standard formulas:
1. Current Ratio: Evaluates overall capacity to settle short-term obligations due within a fiscal cycle using total liquid resources.
2. Quick Ratio (Acid Test): A more conservative measure of financial health. It excludes inventory and prepaid items because they require time to sell and are less readily converted to cash during emergencies.
3. Cash Ratio: The ultimate safety metric. It tests immediate solvency by matching cash and cash equivalents against current liabilities.
Global Reference Standards
While target values fluctuate across commercial sectors, classic regulatory guides suggest:
- Current Ratio: Ideally between
1.5and2.5. Values below1.0signal severe operational distress and high default risks. - Quick Ratio: Minimum threshold of
1.0is recommended to handle immediate commitments comfortably without forced sales of inventory. - Controlling Risk Factor: High current ratios paired with low quick ratios reveal excess capital trapped in slow-moving or obsolete inventory (over-reliance on inventories).
Current Assets and Liquidity Analysis: Comprehensive Guide to Solvency, Asset Management, and Financial Risk
In the management of modern commercial enterprises, maintaining a rigorous understanding of unit economics and cash flow serves as the foundation for long-term viability. While gross transaction volumes and long-term asset values indicate corporate scale, they do not guarantee immediate survival. To evaluate the true short-term operational health of an enterprise, business owners, corporate treasury officers, and institutional investors look to liquidity ratios.
Liquidity analysis is a financial diagnostic tool that translates raw balance sheet parameters into standardized metrics. This process allows analysts to compare companies of different scales, evaluate cash management strategies, track operational efficiencies, and assess short-term solvency under stressed economic conditions. This guide explores the historical foundations, mathematical formulations, industry benchmarks, and strategic optimization models of corporate liquidity.
Understanding the Strategic Importance of Liquidity
To evaluate the mathematical models used to measure liquidity, we must first examine the broader financial framework of short-term asset management. In corporate finance, liquidity refers to an organization’s ability to meet its maturing short-term obligations using assets that can be rapidly converted into cash without significant loss of value.
This dynamic creates several critical financial realities:
$\checkmark$ The Solvency Distinction: Liquidity must not be confused with long-term solvency. A company may possess massive long-term solvency, such as owning valuable factories, real estate, and intellectual property, yet still face bankruptcy if it lacks the immediate liquid cash required to pay weekly wages or settle supplier invoices.
$\checkmark$ The Liquidity Paradox: Holding excessive liquid assets, such as idle cash in low-interest checking accounts, protects a firm against insolvency but reduces overall profitability. Cash is an unproductive asset that does not generate a high return on investment. Conversely, investing all cash into long-term projects maximizes potential returns but exposes the firm to severe default risks if sudden liabilities arise.
$\checkmark$ Working Capital Management: The management of current assets and current liabilities is known as working capital management. This daily operational process ensures that a business maintains sufficient cash flow to continue its operations and satisfy short-term debt obligations.
Deconstructing Current Assets and Liabilities
To run a reliable liquidity model, an analyst must extract and evaluate the primary short-term variables from a company’s balance sheet. Under international accounting standards, short-term parameters are classified based on their expected conversion or settlement within a standard twelve-month operating cycle.
1. Cash and Cash Equivalents
The most liquid asset class on the balance sheet. This category includes physical currency, checking account balances, petty cash, and highly liquid, short-term financial instruments with original maturities of three months or less, such as treasury bills and money market funds.
2. Accounts Receivable
Also referred to as trade debtors, this represents the money owed to the business by customers who purchased goods or services on credit. While accounts receivable are legally binding obligations, they are subject to collection delays and default risks (bad debts).
3. Inventory
This represents raw materials, work-in-progress items, and finished goods held by the company for sale in the ordinary course of business. Inventory is considered the least liquid current asset because it requires a two-step conversion process: first, it must be sold to create a receivable, and then the receivable must be collected to generate cash.
4. Prepaid Expenses
These are advance payments made by the business for goods or services to be received in the future, such as insurance premiums, corporate rent, or annual software licenses. While prepaid expenses cannot be converted back into cash, they are classified as current assets because they eliminate the need for cash outflows during the upcoming operating cycle.
5. Short-term Investments
Marketable securities, such as stocks, bonds, or certificates of deposit (CDs), that are expected to be sold or liquidated within twelve months.
6. Current Liabilities
Short-term financial obligations that the business must settle within one year. This includes accounts payable (trade creditors), short-term loans, accrued wages, taxes owed, and the current portion of long-term debt.
The Mathematical Architecture of Liquidity Ratios
To ensure perfect display on narrow mobile viewports and small screen content boxes, standard multi-variable equations have been factored into single-step, vertically stacked formulations.
1. Total Current Assets Calculation
The total current assets value is the sum of all short-term economic resources owned by the enterprise.$$\text{TCA} = \text{CCE} + \text{AR} + \text{INV} + \text{PE} + \text{STI}$$
Where:
- $\rightarrow$ $\text{TCA}$ represents the Total Current Assets.
- $\rightarrow$ $\text{CCE}$ represents Cash and Cash Equivalents.
- $\rightarrow$ $\text{AR}$ represents Accounts Receivable (Debtors).
- $\rightarrow$ $\text{INV}$ represents Inventory.
- $\rightarrow$ $\text{PE}$ represents Prepaid Expenses.
- $\rightarrow$ $\text{STI}$ represents Short-term Investments.
2. Current Ratio Formulation
The current ratio, or working capital ratio, measures a company’s ability to cover its short-term liabilities with its short-term assets. It is the most common metric used to evaluate general liquidity.$$\text{CR} = \frac{\text{TCA}}{\text{CL}}$$
Where:
- $\rightarrow$ $\text{CR}$ represents the Current Ratio.
- $\rightarrow$ $\text{TCA}$ represents the Total Current Assets.
- $\rightarrow$ $\text{CL}$ represents the Total Current Liabilities.
3. Quick Ratio Formulation (Acid-Test)
The quick ratio provides a more conservative measure of liquidity by excluding inventory and prepaid expenses, focusing strictly on assets that can be converted into cash within ninety days or less.
To simplify the formulation for narrow screens, we first calculate Quick Assets ($\text{QA}$):$$\text{QA} = \text{CCE} + \text{STI} + \text{AR}$$
Using the resulting $\text{QA}$ value, the Quick Ratio ($\text{QR}$) is expressed as:$$\text{QR} = \frac{\text{QA}}{\text{CL}}$$
Where:
- $\rightarrow$ $\text{QR}$ represents the Quick Ratio.
- $\rightarrow$ $\text{QA}$ represents the Quick Assets (highly liquid current assets).
- $\rightarrow$ $\text{CCE}$ represents Cash and Cash Equivalents.
- $\rightarrow$ $\text{STI}$ represents Short-term Investments.
- $\rightarrow$ $\text{AR}$ represents Accounts Receivable.
- $\rightarrow$ $\text{CL}$ represents the Total Current Liabilities.
4. Cash Ratio Formulation
The cash ratio is the most conservative liquidity metric, measuring a company’s ability to pay off its short-term liabilities immediately using only its most liquid assets.
To simplify the formulation for narrow screens, we first calculate Cash Assets ($\text{CA}$):$$\text{CA} = \text{CCE} + \text{STI}$$
Using the resulting $\text{CA}$ value, the Cash Ratio ($\text{ChR}$) is expressed as:$$\text{ChR} = \frac{\text{CA}}{\text{CL}}$$
Where:
- $\rightarrow$ $\text{ChR}$ represents the Cash Ratio.
- $\rightarrow$ $\text{CA}$ represents the Cash Assets (cash and marketable securities).
- $\rightarrow$ $\text{CCE}$ represents Cash and Cash Equivalents.
- $\rightarrow$ $\text{STI}$ represents Short-term Investments.
- $\rightarrow$ $\text{CL}$ represents the Total Current Liabilities.
Understanding the Liquidity Spectrum and Risk Assessments
Evaluating liquidity ratios requires a balanced approach. While high ratios suggest safety, they can also point to operational inefficiencies that drag down corporate returns.
The Risk Profiles Deconstructed
The relationships between these three ratios reveal several distinct corporate liquidity profiles:
- Insolvency Danger Zone (Current Ratio < 1.0): The company does not possess enough short-term assets to cover its upcoming liabilities. This signals a high risk of default, which can lead to forced asset sales, costly restructuring, or bankruptcy.
- Over-Reliance on Inventory (High Current Ratio, Low Quick Ratio): This occurs when a business has a healthy current ratio but a low quick ratio. It reveals that a large portion of the company’s working capital is tied up in slow-moving inventory. If sales slow down, the company may struggle to pay its immediate bills.
- Direct Cash Shortage (High Current/Quick Ratios, Low Cash Ratio): This profile suggests that the company’s liquidity is heavily dependent on collecting accounts receivable. If customers delay payments, the company may face sudden cash shortages.
- Capital Inefficiency (Current Ratio > 3.0, Cash Ratio > 1.5): While very safe, holding excessive cash or low-yielding short-term assets suggests that management is not reinvesting capital efficiently to grow the business.
- Optimal Balance (Current Ratio between 1.5 and 2.5, Quick Ratio > 1.0): Indicates a healthy, stable liquidity position. The company has sufficient resources to handle its short-term obligations comfortably without keeping too much capital idle.
Industry Benchmarks and Sector Analysis
Different industries operate under distinct economic structures, meaning target liquidity ratios vary widely across sectors. A high-volume business with daily cash sales can operate successfully with low liquidity ratios, whereas a manufacturing firm with long production cycles requires a much larger liquidity cushion.
The table below outlines typical liquidity benchmarks across key industries:
| Industry Classification | Target Current Ratio | Target Quick Ratio | Typical Cash Ratio | Key Liquidity Characteristics |
| Retail Grocery Chains | $1.0 – 1.3$ | $0.2 – 0.5$ | $0.1 – 0.2$ | Low ratios are normal because inventory turns over rapidly and customers pay immediately in cash. |
| Enterprise Software (SaaS) | $1.8 – 2.5$ | $1.7 – 2.4$ | $0.8 – 1.5$ | High ratios are common because software companies have negligible inventory and collect subscription revenues upfront. |
| Heavy Manufacturing | $1.5 – 2.2$ | $0.8 – 1.2$ | $0.2 – 0.4$ | Requires a larger liquidity cushion to support long production timelines and carry raw material inventories. |
| Construction & Contracting | $1.2 – 1.6$ | $0.9 – 1.3$ | $0.1 – 0.3$ | Highly dependent on progressive milestone billing and collecting accounts receivable from developers. |
| Public Utilities | $0.8 – 1.2$ | $0.6 – 0.9$ | $0.1 – 0.2$ | Can operate safely with low liquidity due to highly stable, regulated cash inflows from utility bills. |
Real-World Calculation Case Studies
To see how these formulas apply in practice, we can analyze two detailed operational scenarios: a high-tech software company and a regional manufacturing business.
Case Study A: PeakScale Software Inc.
An enterprise software company evaluates its short-term financial position at the end of the fiscal quarter.
- $\rightarrow$ Cash & Cash Equivalents ($\text{CCE}$) = $\$50,000.00$
- $\rightarrow$ Accounts Receivable ($\text{AR}$) = $\$40,000.00$
- $\rightarrow$ Inventory ($\text{INV}$) = $\$0.00$
- $\rightarrow$ Prepaid Expenses ($\text{PE}$) = $\$5,000.00$
- $\rightarrow$ Short-term Investments ($\text{STI}$) = $\$10,000.00$
- $\rightarrow$ Total Current Liabilities ($\text{CL}$) = $\$60,000.00$
Step 1: Calculate Total Current Assets$$\text{TCA} = \text{CCE} + \text{AR} + \text{INV} + \text{PE} + \text{STI}$$$$\text{TCA} = 50,000.00 + 40,000.00 + 0.00 + 5,000.00 + 10,000.00$$$$\text{TCA} = 105,000.00$$
Where:
- $\rightarrow$ $\text{TCA}$ represents the Total Current Assets.
Step 2: Calculate the Current Ratio$$\text{CR} = \frac{\text{TCA}}{\text{CL}}$$$$\text{CR} = \frac{105,000.00}{60,000.00}$$$$\text{CR} = 1.75$$
Where:
- $\rightarrow$ $\text{CR}$ represents the Current Ratio.
Step 3: Calculate the Quick Ratio
First, calculate the Quick Assets ($\text{QA}$):$$\text{QA} = \text{CCE} + \text{STI} + \text{AR}$$$$\text{QA} = 50,000.00 + 10,000.00 + 40,000.00$$$$\text{QA} = 100,000.00$$
Next, divide the Quick Assets by Current Liabilities:$$\text{QR} = \frac{\text{QA}}{\text{CL}}$$$$\text{QR} = \frac{100,000.00}{60,000.00}$$$$\text{QR} \approx 1.67$$
Where:
- $\rightarrow$ $\text{QR}$ represents the Quick Ratio.
Step 4: Calculate the Cash Ratio
First, calculate the Cash Assets ($\text{CA}$):$$\text{CA} = \text{CCE} + \text{STI}$$$$\text{CA} = 50,000.00 + 10,000.00$$$$\text{CA} = 60,000.00$$
Next, divide the Cash Assets by Current Liabilities:$$\text{ChR} = \frac{\text{CA}}{\text{CL}}$$$$\text{ChR} = \frac{60,000.00}{60,000.00}$$$$\text{ChR} = 1.00$$
Where:
- $\rightarrow$ $\text{ChR}$ represents the Cash Ratio.
PeakScale Software shows an excellent liquidity position, with a healthy current ratio of $1.75$, a strong quick ratio of $1.67$, and a cash ratio of $1.00$. This indicates the company can cover its short-term liabilities comfortably without relying on inventory sales.
Case Study B: Urban Fabricators Ltd.
A regional manufacturing business manages a large physical inventory and carries significant trade debt.
- $\rightarrow$ Cash & Cash Equivalents ($\text{CCE}$) = $\$15,000.00$
- $\rightarrow$ Accounts Receivable ($\text{AR}$) = $\$25,000.00$
- $\rightarrow$ Inventory ($\text{INV}$) = $\$120,000.00$
- $\rightarrow$ Prepaid Expenses ($\text{PE}$) = $\$5,000.00$
- $\rightarrow$ Short-term Investments ($\text{STI}$) = $\$5,000.00$
- $\rightarrow$ Total Current Liabilities ($\text{CL}$) = $\$80,000.00$
Step 1: Calculate Total Current Assets$$\text{TCA} = \text{CCE} + \text{AR} + \text{INV} + \text{PE} + \text{STI}$$$$\text{TCA} = 15,000.00 + 25,000.00 + 120,000.00 + 5,000.00 + 5,000.00$$$$\text{TCA} = 170,000.00$$
Where:
- $\rightarrow$ $\text{TCA}$ represents the Total Current Assets.
Step 2: Calculate the Current Ratio$$\text{CR} = \frac{\text{TCA}}{\text{CL}}$$$$\text{CR} = \frac{170,000.00}{80,000.00}$$$$\text{CR} = 2.13$$
Where:
- $\rightarrow$ $\text{CR}$ represents the Current Ratio.
Step 3: Calculate the Quick Ratio
First, calculate the Quick Assets ($\text{QA}$):$$\text{QA} = \text{CCE} + \text{STI} + \text{AR}$$$$\text{QA} = 15,000.00 + 5,000.00 + 25,000.00$$$$\text{QA} = 45,000.00$$
Next, divide the Quick Assets by Current Liabilities:$$\text{QR} = \frac{\text{QA}}{\text{CL}}$$$$\text{QR} = \frac{45,000.00}{80,000.00}$$$$\text{QR} \approx 0.56$$
Where:
- $\rightarrow$ $\text{QR}$ represents the Quick Ratio.
Step 4: Calculate the Cash Ratio
First, calculate the Cash Assets ($\text{CA}$):$$\text{CA} = \text{CCE} + \text{STI}$$$$\text{CA} = 15,000.00 + 5,000.00$$$$\text{CA} = 20,000.00$$
Next, divide the Cash Assets by Current Liabilities:$$\text{ChR} = \frac{\text{CA}}{\text{CL}}$$$$\text{ChR} = \frac{20,000.00}{80,000.00}$$$$\text{ChR} = 0.25$$
Where:
- $\rightarrow$ $\text{ChR}$ represents the Cash Ratio.
Strategic Review: This comparison illustrates how inventory impacts liquidity. On paper, Urban Fabricators looks very safe, with a high current ratio of $2.13$. However, its quick ratio is a weak $0.56$ and its cash ratio is only $0.25$.
This reveals that the company is heavily dependent on selling its physical inventory to pay its bills. If inventory sales slow down, the business could quickly face a severe cash shortage, proving the danger of relying solely on the current ratio to judge financial health.
Best Practices for Optimizing Corporate Liquidity
Improving your company’s liquidity ratios requires a structured approach to managing your short-term assets and liabilities:
- Optimize the Cash Conversion Cycle: The Cash Conversion Cycle (CCC) measures the time it takes to purchase raw materials, convert them into finished goods, sell those goods, and collect the cash from customers. Minimizing this cycle improves cash flow and naturally boosts liquidity.
- Manage Accounts Receivable (DSO): Days Sales Outstanding (DSO) measures the average number of days it takes to collect payments from customers. Businesses can reduce DSO and speed up cash collections by offering early payment discounts, conducting credit checks on new clients, and actively following up on overdue invoices.
- Improve Inventory Turnovers: Excess inventory ties up valuable cash and increases warehouse storage costs. Implement Just-In-Time (JIT) inventory models or use Economic Order Quantity (EOQ) calculations to align stock levels closely with customer demand.
- Negotiate Better Supplier Terms (DPO): Days Payable Outstanding (DPO) measures the average number of days a company takes to pay its suppliers. Extending payment terms with suppliers allows you to keep cash in your bank account longer, which directly improves your daily liquidity position.
Academic Foundations and Accounting Standards
The calculations, classifications, and financial guidelines outlined in this document are based on the standard practices established by:
- International Accounting Standards Board. (2018). International Accounting Standard 1 (IAS 1): Presentation of Financial Statements. IFRS Foundation.
- For official regulatory updates on corporate accounting standards, financial disclosure requirements, and global reporting frameworks, consult the International Financial Reporting Standards (IFRS) database.
Download E-Book
You can download Current Assets and Liquidity Ratio Calculator E-Book here.
Video explains the concept
This Video explains Current Assets and Liquidity Ratio.